
Custom Software Development Cost: 2026 Pricing & Timeline Benchmarks
January 14, 2026

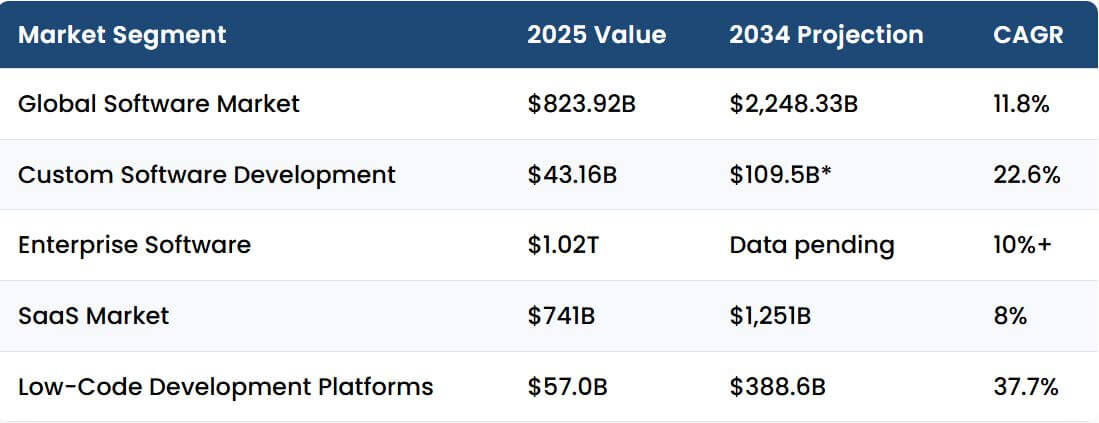
Between October 2024 and January 2026, our research team compiled pricing data from over 200 verified custom software development projects across North America, Europe, and Asia. We analyzed hourly rates, project budgets, delivery timelines, and cost breakdowns to provide decision-makers with transparent benchmarks for evaluating real-world software development investments.
Questions about custom software development cost typically surface at moments of scrutiny— when budgets are under pressure, when vendor proposals vary by 200%, or CFOs are asked to justify investment in systems that may not show returns for 12–18 months.
In our experience, organizations make better investment decisions when they understand not just average rates, but what actually drives cost variation; team seniority, delivery model, risk tolerance, and the post-launch costs that rarely appear in initial estimates.
This report presents industry data alongside real-world pricing structures, helping CTOs, VPs of Engineering, and CFOs assess costs, justify budgets, and compare vendor proposals with confidence.
Hourly Rates by Geography and Seniority: 2026
Geographic location remains one of the strongest predictors of custom software development pricing. The table below reflects average hourly rates across five major outsourcing regions, broken down by developer seniority level.
The Software Development Hourly Rates by Region and Seniority: 2026
| Region | Junior Developer | Mid-Level Developer | Senior Developer | Notes |
|---|---|---|---|---|
| North America (US/Canada) | $55–$100 | $90–$149 | $125–$250+ | Highest rates; strong cultural alignment and time zone compatibility for U.S. clients |
| Central & Northern Europe | $50–$80 | $65–$95 | $95–$150 | Strong technical talent; EU-standard compliance; moderate cost |
| Western Europe | $135–$145 | $145–$155 | $150–$165 | Premium pricing; mature markets |
| Latin America | $30–$55 | $35–$60 | $45–$75 | Nearshore advantage for U.S. clients; similar time zones |
| Asia | $20–$30 | $25–$35 | $30–$50 | Lowest cost; variable quality; time zone challenges for U.S. clients |
Key Findings:
- U.S.-based senior developers command rates between $125–$250+ per hour, reflecting expertise, regulatory familiarity, and direct client collaboration.
- Central and Northern Europe offer competitive pricing ($50–$95/hour) with strong engineering education and GDPR-compliant processes.
- Latin America provides nearshore advantages with real-time collaboration options and rates often 30–50% lower than domestic teams.
- Asia remains the most cost-effective option but in practice, those savings come with increased coordination overhead, longer feedback cycles due to time zones, and greater reliance on internal project management to maintain delivery quality.
For organizations that depend on senior-level expertise, architectural oversight, or mission-critical system development, North American and Western European firms typically deliver the highest consistency, though at premium rates. Firms focused on cost optimization often combine nearshore execution with onshore leadership to balance risk, delivery speed, and governance.
Project Cost by Complexity: 2026 Benchmarks
Software development costs vary significantly based on functional scope, technical architecture, integrations, and compliance requirements. The table below segments projects by complexity tier, with typical cost ranges and delivery timelines.
The Software Development Cost by Project Complexity: 2026
| Complexity Level | Typical Cost Range | Timeline | Characteristics |
|---|---|---|---|
| Simple / MVP | $40,000–$120,000 | 2–4 months | Basic feature set, single platform, limited integrations, simple UI |
| Medium Complexity | $120,000–$300,000 | 4–8 months | Multi-platform support, custom workflows, third-party integrations, moderate data volume |
| High Complexity | $300,000–$1,000,000+ | 8–18+ months | Enterprise-grade systems, complex architecture, real-time processing, advanced security, compliance-heavy (HIPAA, SOC 2), high scalability requirements |
Industry-Specific Examples:
- Healthcare software: $75,000–$250,000+ (dependent on HIPAA compliance, EHR integration, patient data security)
- FinTech platforms: $90,000–$300,000+ (payment processing, fraud detection, regulatory compliance)
- Logistics & supply chain: $50,000–$250,000+ (route optimization, inventory tracking, API integrations)
According to Clutch’s 2026 pricing data, the average custom software project costs $132,480, with a typical delivery timeline of 13 months. However, project-specific variables; team composition, technology stack, and change management processes, can shift budgets by 30–50% in either direction.
Startups building MVPs typically invest $40,000–$60,000 to validate market demand.
Mid-market organizations such as regional healthcare networks modernizing patient intake systems or manufacturers building custom warehouse management applications- allocate $120,000–$300,000 for integrated systems that connect legacy ERPs with modern cloud platforms.
Enterprises managing mission-critical platforms, like financial institutions building real-time fraud detection, insurance carriers modernizing underwriting engines, or logistics providers optimizing route planning at scale; budget $300,000–$1,000,000+, prioritizing security, compliance, and long-term maintainability over speed to market.
Timeline Estimates: From Discovery to Deployment
Development timelines depend on project scope, team size, architectural complexity, and the rigor of quality assurance processes. The table below outlines typical phases and durations for projects of varying scale.
The Development Timeline Breakdown by Project Phase: 2026
| Phase | Simple Project | Medium Project | Complex Project |
|---|---|---|---|
| Discovery & Planning | 1–2 weeks | 2–4 weeks | 4–8 weeks |
| Design (UX/UI) | 2–3 weeks | 3–5 weeks | 6–10 weeks |
| Development (Frontend/Backend) | 6–10 weeks | 12–20 weeks | 24–52+ weeks |
| QA & Testing | 2–3 weeks | 4–6 weeks | 6–12 weeks |
| Deployment & Training | 1 week | 1–2 weeks | 2–4 weeks |
| Total Timeline | 2–4 months | 4–8 months | 8–18+ months |
Factors That Extend Timelines:
- Scope creep: Unplanned feature additions can extend timelines by 15–30% and inflate budgets accordingly.
- Integration complexity: Connecting to legacy systems, ERPs, or third-party APIs often requires additional testing cycles.
- Regulatory compliance: HIPAA, GDPR, SOC 2, and PCI-DSS requirements add 2–6 weeks for audit preparation and certification.
- Team ramp-up: Distributed or offshore teams may require 2–4 weeks for onboarding and process alignment.
In our experience, timeline pressure creates false economies. Organizations that rush through discovery “to start development faster” typically surface scope misalignment within the first one to two months, forcing rework that erases any time saved upfront. The same pattern appears when QA is underfunded to meet aggressive launch dates. Defects are pushed into production where fixes routinely cost 5–10x more and introduce real operations and reputational risk.
The most predictable projects don’t rely on artificial certainty. They invest in upfront clarity, then execute with enough flexibility to adapt as real constraints and unknowns surface.
Cost Breakdown: Design, Development, QA, and Project Management
Understanding how development budgets are allocated across roles and functions helps decision-makers evaluate vendor proposals and identify cost inefficiencies. The breakdown below reflects typical allocations for a mid-sized custom software project.
The Software Development Cost Allocation by Function: 2026
| Function | % of Total Budget | Typical Activities |
|---|---|---|
| Development (Frontend/Backend) | 40–50% | Feature implementation, API development, database design, architecture |
| Quality Assurance (QA) | 15–25% | Test planning, automated testing, manual testing, bug tracking, regression testing |
| Design (UX/UI) | 10–20% | User research, wireframing, prototyping, visual design, design systems |
| Project Management | 10–15% | Sprint planning, backlog management, stakeholder communication, risk tracking |
| DevOps & Infrastructure | 5–10% | CI/CD pipeline, cloud configuration, monitoring, security hardening |
Example: $200,000 Project Budget Allocation
- Development: $90,000 (45%)
- QA: $40,000 (20%)
- Design: $30,000 (15%)
- Project Management: $25,000 (12.5%)
- DevOps: $15,000 (7.5%)
Key Insights:
- Development typically represents the largest share of project costs (40–50%), reflecting the technical complexity of building scalable, maintainable systems.
- QA investment (15–25%) is essential for mission-critical applications. Underfunding testing often results in post-launch failures that cost 5–10x more to fix than issues caught during development.
- Design (10–20%) is frequently undervalued, yet poor UX directly increases support costs and reduces user adoption, particularly for internal tools where employee resistance can derail ROI.
- Project management overhead (10–15%) ensures alignment between technical execution and business objectives, reducing the risk of scope drift and missed milestones.
Organizations that allocate less than 15% to QA or skip dedicated project management often experience budget overruns, timeline delays, and technical debt accumulation that compounds maintenance costs.
Across enterprise engagements, cost allocation reflects priorities—and priorities drive outcomes. Teams that underfund QA or project management rarely save money; they simply shift cost into production incidents, rework, and operational instability. The allocation percentages above are not arbitrary, they reflect what sustainable delivery actually requires when systems must remain stable, secure, and maintainable beyond launch.
Hidden Costs: Post-Launch Factors That Increase the Cost of Custom Software Development
Initial development costs represent only a fraction of the cost of custom software development. In our experience, the most common source of buyer’s remorse isn’t what organizations pay to build software—it’s what they didn’t plan for after launch.
Most organizations budget for development but not for the 15–25% annual maintenance required to keep systems secure, compliant, and useful in real-world operations. They account for hosting but not for the infrastructure scaling costs that emerge once real user volume hits. They plan for launch, but not for the training, onboarding, and change management required to drive adoption; leaving expensive systems underutilized because users revert to familiar manual processes.
The organizations that avoid these surprises model total cost of ownership (TCO) over 3–5 year horizon from the outset, treating maintenance, security, and adaptation as non-negotiable operating costs—not unexpected add-ons.
The Hidden and Recurring Costs in Custom Software: 2026
| Cost Category | Annual Cost Range | Description |
|---|---|---|
| Maintenance & Support | 15–25% of initial dev cost | Bug fixes, updates, patches, technical support |
| Hosting & Infrastructure | $500–$10,000+/month | Cloud hosting (AWS, Azure, GCP), databases, CDN, backups |
| Third-Party Licenses | $1,000–$20,000+/year | APIs, SaaS tools, monitoring platforms, analytics |
| Security & Compliance | $5,000–$50,000+/year | Penetration testing, audits (SOC 2, HIPAA), vulnerability scanning |
| Feature Enhancements | 10–15% of initial cost/year | New features, UX improvements, platform updates |
| Training & Onboarding | $2,000–$10,000+ | Initial training, documentation, ongoing education for new hires |
| Downtime & Incident Response | Variable | Productivity losses, revenue impact during outages |
Example: $200,000 Initial Development Cost
- Year 1 Maintenance: $30,000–$50,000 (15–25%)
- Year 1 Hosting: $6,000–$24,000
- Year 1 Licenses: $5,000–$10,000
- Year 1 Security: $10,000–$20,000
- Total Year 1 TCO: $251,000–$304,000 (26–52% above initial cost)
Real-World Example:
Keyhole recently partnered with a Midwest logistics provider to modernize their warehouse management system. While the initial custom development investment was $280,000, the client eliminated $85,000 in annual COTS licensing fees, avoided $40,000 in planned hardware replacement (by integrating directly with legacy Honeywell scanners), and reduced training costs to near-zero by replicating the familiar green-screen UI in a modern React application.
By Year 2, total cost of ownership was 35% lower than the COTS alternative they had been evaluating. And beyond the numbers, the client owned the IP, controlled the roadmap, and avoided vendor dependency; a combination that, in our experience, often delivers far more long-term value than any upfront savings.
Most Frequently Overlooked Costs:
- Maintenance and support: Annual maintenance typically equals 15–25% of initial development cost—$30,000–$50,000 per year for a $200,000 project. Skipping this budget line leads to technical debt accumulation and system degradation.
- Compliance and security: HIPAA, GDPR, and SOC 2 audits cost $5,000–$50,000 annually. Penetration testing adds $5,000–$20,000 per assessment. Organizations in regulated industries must factor these into TCO from day one.
- Staff training and change management: Poor adoption due to insufficient training can reduce ROI by 30–50%. Budget $2,000–$10,000 for role-based training, documentation, and onboarding materials.
- Integration and API costs: Third-party APIs (payment processing, mapping, CRM connectors) often charge per transaction or monthly fees that scale with usage. A system processing 100,000 API calls/month can incur $500–$5,000/month in API fees alone.
- Downtime and incident response: Unplanned outages cost enterprises an average of $5,600 per minute, according to Gartner. Budgeting for incident response, monitoring, and disaster recovery testing ($10,000–$30,000/year) reduces downtime risk.
Organizations that model TCO over 3–5 years rather than focusing solely on initial development cost make better-informed decisions about build vs. buy, vendor selection, and architectural trade-offs.
ROI Calculation Framework: Measuring Software Investment Returns
Calculating return on investment (ROI) for custom software means looking beyond upfront costs to capture both financial gains and strategic value. We consistently see systems deliver returns when they solve real operational problems, receive executive support, and are adopted into daily workflows; not simply because they meet technical specifications. The framework below gives CFOs and other budget owners a structured way to model ROI, grounded in real-world outcomes and tradeoffs.
Basic ROI Formula For Custom Software Costs
ROI (%) = [(Total Benefits – Total Costs) / Total Costs] × 100
Where:
- Total Benefits = Revenue increases + cost savings + productivity gains (over 1–3 years)
- Total Costs = Initial development + maintenance + hosting + licenses + training (over same period)
Tangible Benefits: Revenue and Cost Reduction
Revenue Enhancement:
- Increased sales: E-commerce platforms, CRM systems, and lead management tools drive measurable revenue growth. A 5% increase in conversion rates on $10M in sales generates $500,000 in additional revenue annually.
- New revenue streams: Custom software enables new products or services. A B2B SaaS platform generating $50,000/month in recurring revenue adds $600,000 annually.
- Customer retention: Improved UX increases customer lifetime value (LTV). A 5% improvement in retention on a $5M revenue base adds $250,000/year.
Cost Reduction:
- Labor automation: Automating manual processes saves labor hours. Example: Reducing invoice processing time by 40% for 3 FTEs at $60,000/year saves $72,000 annually.
- Error reduction: Eliminating manual data entry errors reduces rework costs. A company losing $15,000/year to duplicate payments recovers that cost immediately.
- Operational efficiency: Streamlined workflows reduce overhead. Logistics software cutting delivery routes by 10% can save $300,000–$400,000/year in fuel and labor.
Intangible Benefits: Strategic Value
While harder to quantify, intangible benefits often determine whether custom software becomes a competitive advantage or a sunk cost. We frequently see systems that encode proprietary workflows, real-time decision logic, or operational insight routinely outperform ROI models based on cost savings alone.
- Improved customer satisfaction: Measured via NPS/CSAT surveys; directly linked to retention and lifetime value
- Employee productivity and morale: Efficient tools reduce frustration and turnover (valued at 50–200% of annual salary per departed employee)
- Competitive differentiation: Proprietary workflows and algorithms competitors cannot replicate
- Data-driven decision-making: Centralized analytics reduce time-to-insight by 40–60% in well-designed systems
- In our experience, organizations that succeed with custom software view these intangible benefits as strategic investments, not nice-to-haves. Systems that encode competitive advantages, like real-time underwriting models or proprietary logistics algorithms, deliver returns that far exceed cost savings alone.
Example ROI Calculation: $200,000 Custom CRM Project
Total Costs (Year 1):
- Development: $200,000
- Maintenance: $40,000 (20%)
- Hosting: $12,000
- Training: $8,000
- Total Year 1 TCO: $260,000
Total Benefits (Year 1):
- Increased sales (2% conversion improvement): $400,000
- Retained revenue (5% churn reduction): $150,000
- Productivity gains (10 reps × 10 hrs/week saved): $187,500
- Total Year 1 Benefits: $737,500
Year 1 ROI: [($737,500 – $260,000) / $260,000] × 100 = 184%
3-Year NPV (10% discount rate): Assuming stable benefits and declining costs, the net present value over 3 years would exceed $1.2M, with IRR exceeding 150%.
Industry Benchmarks: What is “Good” ROI?
- 5–10% ROI: Acceptable; beats inflation and justifies capital allocation.
- 20–30% ROI: Strong performance; typical for well-executed automation or efficiency projects.
- 50%+ ROI: Exceptional; often seen in high-impact e-commerce, CRM, or process automation projects.
Across enterprise engagements, the difference between projects that deliver ROI and those that don’t is rarely the technology, it’s adoption and alignment. Systems that solve real operational problems and receive executive support achieve 70%+ user adoption within 90 days and begin delivering measurable value within 6–12 months. On the other hand, systems built to specifications but disconnected from workflows, underutilized, and quietly abandoned rarely break even, no matter how technically sound they are.
Before modeling ROI, technical leaders should validate that the problem being solved is real, that stakeholders are committed to changing workflows, and that success metrics are defined and trackable. Without these foundations, ROI calculations become theoretical exercises not tools for predicting real-world outcomes.
Key Metrics for Ongoing ROI Monitoring
Organizations should track the following KPIs post-launch to ensure projected ROI is realized:
- Financial KPIs: Revenue growth, cost variance vs. baseline, operating cash flow, profit margins
- Operational KPIs: Process cycle time, error rates, throughput, system uptime
- Adoption KPIs: Active user rate, feature adoption, user satisfaction (CSAT/NPS), support ticket volume
Low user adoption is the most common reason software projects fail to deliver expected ROI. If less than 70% of intended users actively use the system within 90 days, projected benefits are unlikely to materialize.
Keyhole Software: Pricing Philosophy and Approach
At Keyhole, pricing conversations are fundamentally about risk and long-term outcomes, not just hourly rates. Our rates reflect a senior-level, U.S.-based consulting model designed for organizations that require architectural expertise, minimal delivery risk, and systems that remain maintainable years after launch.
Senior-Level, U.S.-Based Expertise
Every Keyhole consultant brings an average of 17+ years of professional experience and is 100% U.S.-based. Clients work directly with hands-on experts who design sound architectures, make informed technology decisions, and mentor internal teams, not junior developers managed remotely.
In our experience, seniority matters most when decisions are hard to reverse. Choosing between microservices and monolithic architecture, designing data models for regulatory compliance, or sequencing modernization work to avoid business disruption; these are judgment calls that benefit from pattern recognition across dozens of similar engagements. Junior teams can execute well-defined tasks. Senior teams shape scope, sequence work to reduce risk, and make tradeoffs that preserve long-term system health even under timeline pressure.
Our rates reflect senior-level, U.S.-based expertise. While premium compared to offshore or junior staffing models, our approach reduces total cost of ownership by preventing technical debt, avoiding rework, and delivering systems that scale and adapt as business needs evolve.
For example, Keyhole built custom insurance agent platforms for Brightway Insurance using .NET and React, delivering real-time policy synchronization that generic CRM platforms couldn’t achieve. The system reduced agent friction, improved close rates, and created a competitive advantage competitors couldn’t purchase off the shelf.
Technology-Agnostic, Business-Driven Solutions
We work across a broad mix of modern and legacy technologies: Java, .NET, JavaScript, and cloud-native architectures on AWS, Azure, and Google Cloud. This breadth allows us to design solutions around each client’s actual environment, constraints, and team capabilities rather than a prescribed technology stack.
In our experience, the best technology decision is the one that fits the problem, aligns with team skills, and supports long-term maintainability. We don’t push a single platform. We assess technical requirements, business constraints, regulatory obligations, and internal capacity to recommend solutions focused on fit, longevity, and total cost of ownership. Whether you’re building new applications or modernizing legacy systems, we focus on reducing risk and supporting your technology roadmap, not promoting a preferred vendor ecosystem.
Transparent Pricing and Scope Management
Keyhole operates primarily on a time-and-materials model for complex enterprise systems, modernization initiatives, and architecture-heavy projects. In our experience, this approach works best when requirements evolve as systems interact with real data, integrations, and operational constraints, which is almost always the case for enterprise software.
Time-and-materials allows teams to surface unknowns early, adapt as technical and organizational realities emerge, and make informed tradeoffs based on current information rather than assumptions made months earlier. It aligns incentives around continuous clarity: work is prioritized based on what is learned, progress is visible, and decisions are made with real data rather than outdated estimates.
During discovery, we provide detailed cost estimates breaking down development, QA, design, and project management allocations. Our estimates include:
- TCO projections: Maintenance, hosting, and licensing costs over 3–5 years
- Risk-adjusted timelines: Accounting for integration complexity, compliance requirements, and team ramp-up
- Phased delivery options: Allowing clients to validate functionality incrementally and adjust scope based on budget constraints or shifting priorities
We don’t hide costs or surprise clients with change orders for work that should have been in scope. Our goal is to provide financial clarity upfront so CFOs and budget owners can allocate capital with confidence, and adjust intelligently as reality unfolds.
Ready to Evaluate Your Next Software Investment?
If you’re evaluating the cost of a custom software initiative; whether it’s modernizing a legacy system, building a new application, or strengthening your internal engineering capabilities; the hardest part is separating real risk from artificial certainty.
Keyhole helps organizations define scope, model true cost of ownership, and structure delivery approaches that hold up once systems meet real users, data, and operational constraints.
Contact Keyhole Software to discuss your project requirements and receive a transparent cost estimate grounded in senior-level expertise and real-world delivery experience.
Sources
- Keyhole Software Research Study – Custom Software Development Cost Analysis. Kansas City, MO. January 2026.
- Clutch – Software Development Company Pricing Guide, January 2026. clutch.co/developers/pricing
- AgileEngine – Software Development Cost Breakdown in 2025: A Complete Guide. agileengine.com
- Cleveroad – How Much Does Software Development Cost: 2025 Breakdown. cleveroad.com
- SOLTECH – How Much Does Custom Software Development Cost in 2025? soltech.net
- Baytech Consulting – A CFO’s Guide to Calculating the ROI of Custom Software Development: From Justification to Long-Term Value Realization, 2025. baytechconsulting.com
- SumatoSoft – How to Calculate the ROI of Custom Software Development, 202. sumatosoft.com
- McKinsey & Company – Tech Debt: Reclaiming Tech Equity, 2024. mckinsey.com
More From Keyhole Software
About Keyhole Software
Expert team of software developer consultants solving complex software challenges for U.S. clients.
Share This Post
Related Posts
Join The Thousands Of Devs Who Subscribe
Discuss This Article
Subscribe
Login
0 Comments
Oldest