
How Much Does Cloud Migration Cost in 2026?
The first question in nearly every cloud migration conversation I’ve been part of is some version of “what is this going to cost?” The honest answer is “it depends,” which is accurate and not very helpful. So our research team at Keyhole went looking for what the published numbers actually say.
Between September and October 2026, we pulled cost data from 45 third-party sources published between 2019 and 2026. They include Forrester Total Economic Impact studies of three enterprise migrations to AWS and Azure, migration research from IDC and Gartner, AWS and Google Cloud migration guidance, Flexera’s 2025 and 2026 State of the Cloud surveys, cloud research from McKinsey and HashiCorp, a June 2026 GAO review of 24 federal agencies, May 2025 wage data from the Bureau of Labor Statistics, the current pricing pages for each provider’s migration tools, and the funding, licensing, and exit-fee terms published by AWS, Microsoft, Google, and Oracle.
We kept one-time migration costs (the labor, services, and training it takes to move) separate from what it costs to run in the cloud afterward. Most published figures, including most vendor ROI numbers, blend the two. The details on how each figure was calculated are in a methodology section at the end.
Average Cloud Migration Cost by Project Size and Complexity
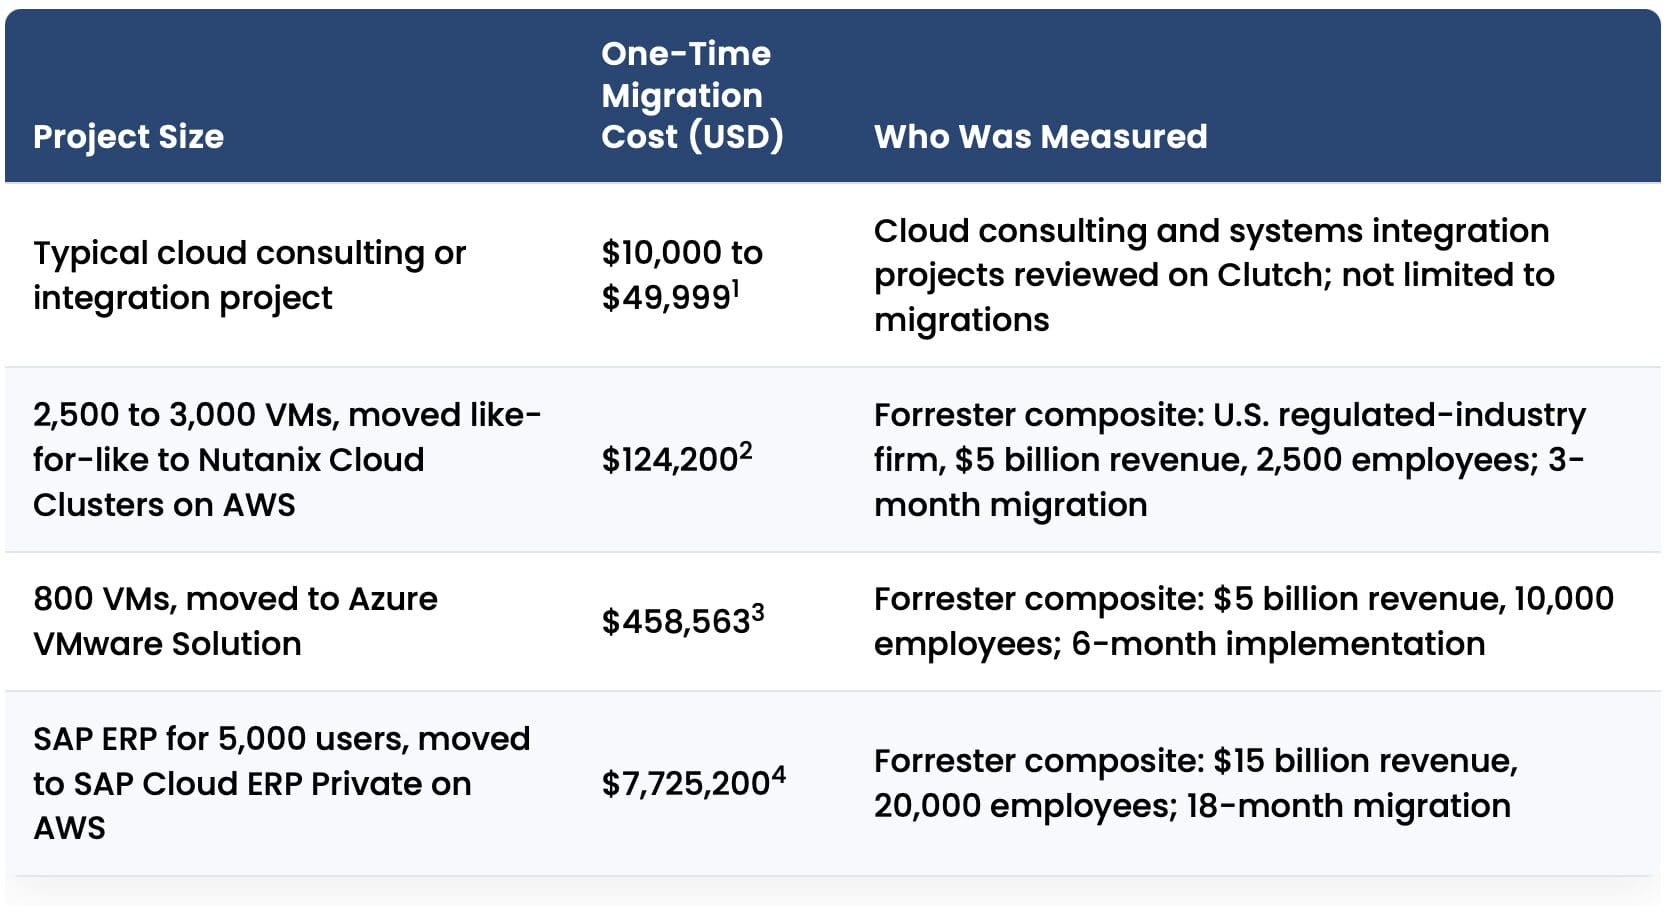
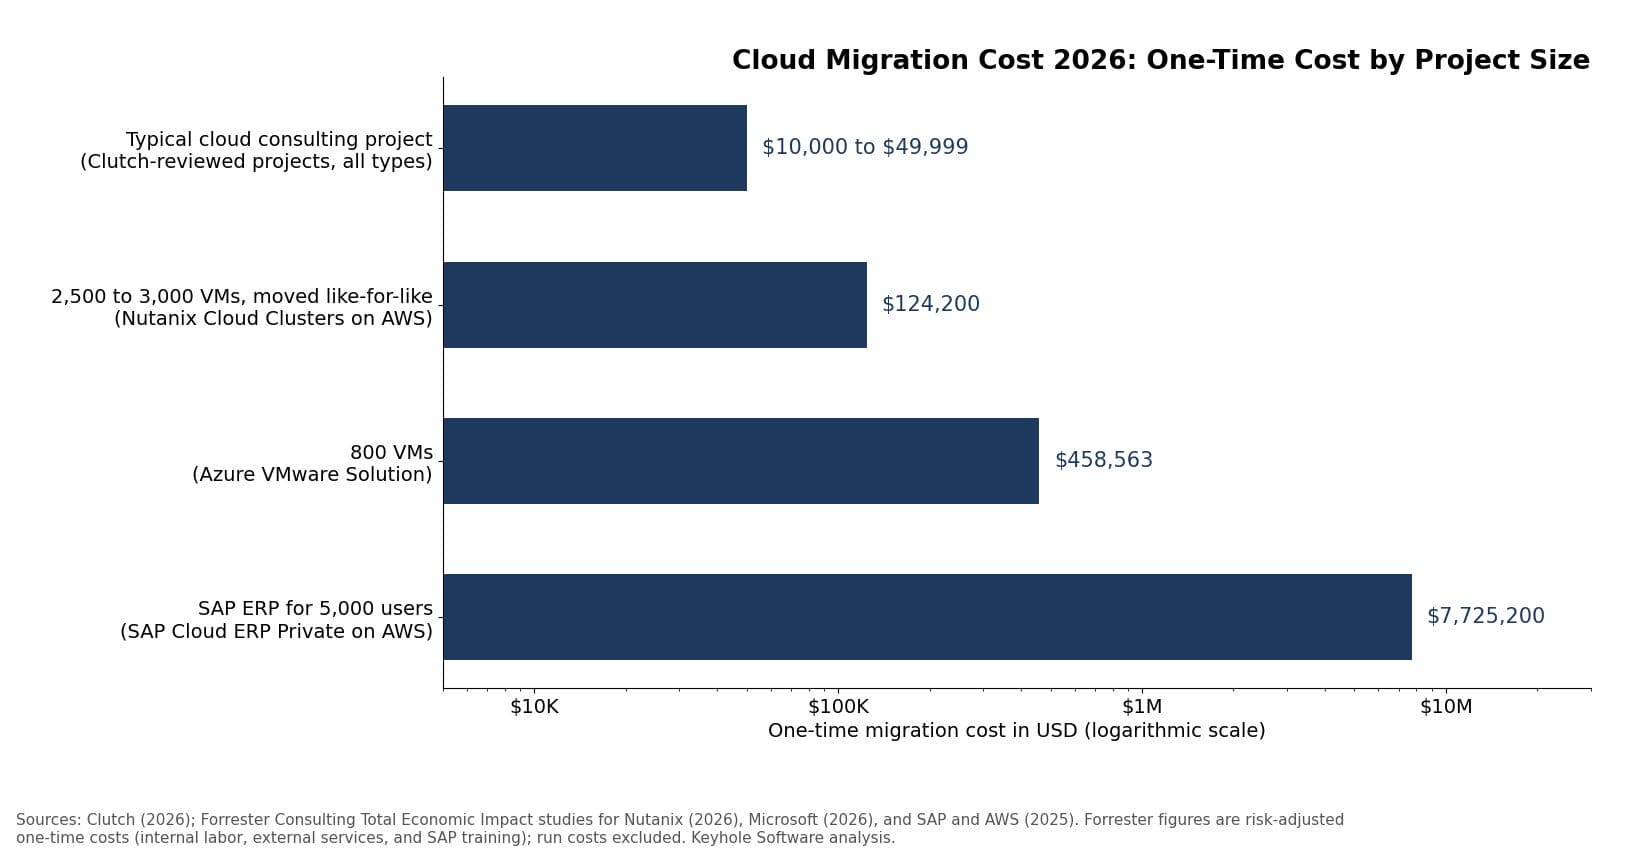
The most useful cost figures come from studies that itemize what one company spent to move a defined set of workloads. Three of the four rows below are Forrester studies, each commissioned by the vendor whose platform the company moved to. Their totals are risk-adjusted, meaning Forrester padded its estimates by 10% to 15% to allow for differences between the organizations it interviewed. The fourth row, from Clutch, covers every cloud consulting project reviewed on its platform, not only migrations.1,2,3,4
As a rough guide, a like-for-like move of a virtualized estate costs in the low hundreds of thousands of dollars. Once the migration changes a core business system, the cost runs into the millions.
One-Time Cloud Migration Cost by Project Size (2026)
| Project Size | One-Time Migration Cost (USD) | Who Was Measured |
|---|---|---|
| Typical cloud consulting or integration project | $10,000 to $49,9991 | Cloud consulting and systems integration projects reviewed on Clutch; not limited to migrations |
| 2,500 to 3,000 VMs, moved like-for-like to Nutanix Cloud Clusters on AWS | $124,2002 | Forrester composite: U.S. regulated-industry firm, $5 billion revenue, 2,500 employees; 3-month migration |
| 800 VMs, moved to Azure VMware Solution | $458,5633 | Forrester composite: $5 billion revenue, 10,000 employees; 6-month implementation |
| SAP ERP for 5,000 users, moved to SAP Cloud ERP Private on AWS | $7,725,2004 | Forrester composite: $15 billion revenue, 20,000 employees; 18-month migration |
The next table converts the same studies to cost per virtual machine and adds Gartner’s estimate for large VMware exits.
Cloud Migration Cost per Virtual Machine
| Migration Scenario | Cost per Virtual Machine (USD) | What the Cost Covers |
|---|---|---|
| Large-scale VMware exit, target platform not specified (Gartner estimate) | $300 to $3,0005 | External migration services only, varying with workload complexity, migration size, and migration type |
| 800 VMs to Azure VMware Solution | About $5733 | Internal labor and systems integrator fees ($458,563 divided by 800 VMs) |
| 2,500 to 3,000 VMs to Nutanix Cloud Clusters on AWS | About $41 to $502 | Internal labor and vendor professional services ($124,200 divided by 3,000 and by 2,500 VMs) |
The Nutanix composite sits far below Gartner’s floor for two reasons. It was a lift-and-shift, with core compute and storage moved to Nutanix Cloud Clusters on AWS without rearchitecting or refactoring applications. And Gartner’s range covers outside services alone, where the Nutanix company spent just $18,000, or about $6 to $7 per VM.2,5
The VMs we’ve seen land at the top of that range usually have a few things in common: hardcoded IP addresses or hostnames, software licensed to physical cores or specific hardware (common with Oracle and older SQL Server agreements), dependencies on on-premises file shares or Active Directory, and chatty connections to a database that isn’t moving in the same wave. None of that shows up in a VM count, so per-VM estimates built from an inventory spreadsheet tend to come in low.
The licensing rules are worth checking before anything moves. On AWS and Azure, Oracle counts two vCPUs as one Processor license when multithreading is on (one vCPU per license when it’s off), doesn’t apply its core factor table, and limits Standard Edition 2 to instances of eight vCPUs or fewer.43 Microsoft licenses bought without Software Assurance or mobility rights can’t be deployed on dedicated hosts from AWS, Google, Alibaba, or Microsoft.44 And SQL Server 2016 reached the end of extended support in July 2026. Unlike SQL Server 2014, moving it to an Azure VM no longer comes with free Extended Security Updates.45,46
Cost and duration move together, since most migration spend is people’s time. Here are the reported timelines, in months, by project size.
Cloud Migration Timeline by Project Size
| Project Size | Migration Timeline (Months) | Who Was Measured |
|---|---|---|
| 2,500 to 3,000 VMs, moved like-for-like | 32 | Forrester composite, Nutanix Cloud Clusters on AWS |
| 800 VMs | 63 | Forrester composite, Azure VMware Solution |
| 51 applications and 444 VMs (averages) | 10.96 | 10 enterprises averaging 43,930 employees, migrating to Azure |
| 2,000 servers, data center exit | 12 (target)7 | One AWS customer, as described in AWS Prescriptive Guidance |
| SAP ERP for 5,000 users | 184 | Forrester composite, SAP Cloud ERP Private on AWS |
| Large-scale VMware exit | 18 to 485 | Gartner estimate |
| More than 10,000 servers | 24 to 36 (plan)7 | One company, as described in AWS Prescriptive Guidance |
Two caveats on this table. The two AWS rows are one organization’s target or plan, not a completed result (for context, AWS considers anything of 300 servers or more a large migration).7,8 And the IDC sample is small, at 10 organizations. Its three-year figure of $23.68 million per organization includes Azure run costs, so it isn’t a one-time migration cost.6
Timelines are uneven inside a single migration, too. The first wave is almost always the slowest, because that’s where the team builds the landing zone, sorts out networking and identity, and writes the runbooks. Later waves reuse that work and move faster.
Why Similar Moves Cost So Differently
The Nutanix composite moved more than three times as many VMs as the Azure VMware Solution composite for about a quarter of the cost. Both were lift-and-shift moves, but the Nutanix company needed far less outside help: $18,000 in vendor services against $168,000 in systems integrator fees.2,3 The SAP composite moved a single core system and spent about 17 times what the 800-VM move did, with systems integrator fees alone coming to $4.14 million of its $7.73 million total.4
Gartner ties its tenfold range of $300 to $3,000 per VM to workload complexity, migration size, and the type of migration.5
In Practice
On one federal engagement, the agency’s 400 to 500 applications each came with a build pipeline maintained by its own team, so there were hundreds of slightly different implementations and uneven security scanning across four technology stacks. A Keyhole team of five architects and a project manager replaced them with a shared Jenkins library that each team configures for its stack, so a fix ships once and applies everywhere. The library went through several major rearchitectures before it settled, and it later carried the agency’s early Docker work and initial move to AWS ECS. Time-to-deployment dropped by more than 30%.9
Cloud Migration Cost by Migration Approach
Cloud providers group migrations into a handful of approaches, usually called the 7 Rs: retire, retain, rehost, relocate, repurchase, replatform, and refactor.10 (Google Cloud’s guidance uses a slightly different list that includes re-architect and rebuild, which is why those show up in the second table.15) We couldn’t find a primary source that publishes a verified dollar cost per approach. What the published data does measure is how much each approach reduces cost after the move, shown below in percent.
Reported Cost Reduction After Migration, by Approach
| Migration Approach | Reported Cost Reduction | What Was Compared |
|---|---|---|
| Migration to AWS, any approach | 20%11 | Infrastructure spend before and after migration, more than 1,000 AWS customers (Hackett Group, 2022) |
| Relocate (VMware Cloud on AWS) | About 50%12 | Combined infrastructure and operations cost versus on-premises (IDC Business Value Snapshot, 2024) |
| Replatform (.NET Framework to .NET on Linux) | 40%13 | Operating cost, driven by removing Windows licensing (AWS statement, 2025) |
| Refactor (applications rebuilt on Azure PaaS) | 40%14 | Application development infrastructure cost (Forrester composite, 2022) |
| Refactor (applications rebuilt as serverless on AWS) | 39%11 | Reported spend reduction for the serverless pathway, 505 AWS customers (Known, 2022) |
The 20% figure is an average per year over six years and covers migrated applications generally, not rehosting alone. The same study found that savings on migrated applications grow from 14% in year two to 30% by year six.11 Retire, retain, and repurchase have no comparable published savings figure, and the providers don’t agree on repurchasing. AWS says it “typically reduces costs associated with maintenance, infrastructure, and licensing,” while Google Cloud warns it “might be a lot more expensive.”10,15
All five figures come from cloud providers or from studies they sponsored, and none of them measures the up-front cost of the migration itself, so they’re best read as the optimistic end of the range.
Nobody publishes a dollar cost to execute each approach, either. AWS and Google Cloud do describe the relative effort in their own migration guidance, and the next table ranks each approach against a rehost using their wording.
Up-Front Migration Effort by Approach
| Migration Approach | Up-Front Effort Relative to Rehost | Provider Guidance |
|---|---|---|
| Relocate | Lower | AWS: “the quickest way to migrate and operate your workload in the cloud”10 |
| Rehost | Baseline | Google Cloud: “requires the least amount of time because the amount of refactoring is kept to a minimum”15 |
| Repurchase | Lower to similar | Google Cloud: “might be a lot easier than refactoring, rebuilding, or re-architecting”15 |
| Replatform | Higher | Google Cloud: “more work to accomplish than rehost migrations”15 |
| Refactor | Much higher | AWS: “the most complex and costly of the migration strategies”10 |
| Re-architect or rebuild | Highest | Google Cloud: re-architecting is “more complex than a refactor migration, so it takes more time and effort”15 |
The ranking is our reading of the provider language, not a measured value. The one quantified comparison we found is an estimate: in Forrester’s Azure VMware Solution study, a retail VP of compute estimated that refactoring the same VMs to run natively would have taken “more like 10 times plus” the effort of relocating them.3
It’s also worth knowing that AWS doesn’t recommend refactoring during large migrations. Its guidance is to rehost, relocate, or replatform first and modernize “after the migration is complete.”10
Reading the Savings Figures
The broad migration figure of 20% a year sits well below the roughly 40% reported for replatforming and refactoring, which change more of the stack and cost the most to execute.11,13,14 The single relocate figure of about 50% compares a full VMware Cloud on AWS environment with on-premises infrastructure and operations combined, which is a broader baseline than the other rows use.12
Enterprises haven’t settled on one answer. In a 2024 ESG survey of 500 senior leaders, 73% said they actively refactored applications during cloud migration, and 80% agreed the value of public cloud is only fully realized if applications are modernized as they move.16 Meanwhile, more than half of the 50 companies McKinsey interviewed used lift-and-shift as their primary strategy, even though many reported getting little value from it.17
For a provincial government agency, a single embedded Keyhole architect replatformed legacy .NET Framework 4.6.1 applications to .NET 8 on OpenShift and Kubernetes, using AWS services for authentication, storage, and serverless functions. The old .NET code was tied to the servers it had been written for, so the team defined the target container architecture first and reworked the code once against it. Windows Server licensing costs dropped by about 60%, and releases went from quarterly to weekly.18
Licensing is where I’ve seen replatforming pay back fastest, since those savings start the day the old runtime is switched off. Assessment also tends to turn up applications that can be retired or consolidated before the move, which takes their labor, testing, and run cost off the table.
Cloud Migration Cost Breakdown
The Forrester studies itemize their one-time costs, which makes them the clearest public view of where a migration budget goes. The table below breaks down the same three enterprise migrations from the first table, in U.S. dollars.
One-Time Cloud Migration Cost Breakdown for Three Enterprise Migrations
| Cost Component | 2,500 to 3,000 VMs (Nutanix on AWS) | 800 VMs (Azure VMware Solution) | SAP ERP, 5,000 Users (SAP on AWS) |
|---|---|---|---|
| Internal staff labor | $90,0002 | $230,7503 | $2,448,0004 |
| External services (systems integrator or vendor professional services) | $18,0002 | $168,0003 | $3,600,0004 |
| Training and change management | Not itemized | Not itemized | $700,0004 |
| Forrester risk adjustment | $16,2002 | $59,8133 | $977,2004 |
| Total one-time migration cost | $124,2002 | $458,5633 | $7,725,2004 |
Labor dominates all three. Internal staff and external services make up the entire component total in the Nutanix and Azure VMware Solution moves and about 90% of it in the SAP move, where training accounts for the rest.2,3,4 The share paid to outside firms climbs with complexity, from about 17% of the Nutanix component total to 42% for Azure VMware Solution and 53% for SAP.2,3,4
The published cost summaries don’t list assessment tooling, data transfer, or parallel running as separate one-time lines, so those costs are either buried in labor and platform fees or not captured. They also leave out several costs that come up in nearly every migration we’ve worked on: rebuilding monitoring and alerting, updating runbooks and on-call procedures, security review or re-accreditation of the target environment, and performance tuning and rightsizing after cutover.
Migration tooling is one of the smallest lines in most budgets, since all three major clouds offer their native migration tools free, either for a set period or, in Google Cloud’s case, at no charge for migrations in.
Free Use Period for Native Cloud Migration Tools (2026)
| Native Migration Tool | Free Use Period (Days) | What Is Still Billed |
|---|---|---|
| AWS Transform MGN (formerly AWS Application Migration Service) | 90 per source server (2,160 hours)19 | AWS infrastructure provisioned for replication, plus compute and storage for test and cutover instances |
| Azure Migrate (server migration) | 180 per machine, then $25 per month per replicated instance20 | Storage, transactions, and data transfer |
| Google Cloud Migrate to Virtual Machines | No charge for migrations into Google Cloud21 | Compute Engine instances for test clones and cutover, and source-cloud resources |
Data transfer is usually small as well. AWS says more than 90% of its customers already pay nothing to transfer data out because of a 100 GB monthly free allowance, and since March 2024 it has waived data transfer out charges for eligible customers leaving AWS. Customers outside the EU now get 180 days to finish that move.27 What the free tools don’t cover is the infrastructure they spin up. AWS says customers “will incur charges for any AWS infrastructure” provisioned for replication, “including during the free period.” Azure bills for replication storage, transactions, and data transfer, and Google Cloud bills for the Compute Engine instances used for test clones and cutover.19,20,21 On the licensing side of parallel running, Azure Hybrid Benefit allows 180 days of using the same Windows Server and SQL Server licenses both on premises and in Azure during a migration.47
If you’re moving between clouds, AWS isn’t the only provider that waives exit fees. Google announced its program in January 2024 and Microsoft in March 2024, both with tighter conditions.48 Google requires an Exit Notice before any data moves, doesn’t cover moving only part of a service, and gives at least 30 days to finish.49 Microsoft’s program covers only full exits with every Azure subscription cancelled, applies only to Azure Storage data, and credits at most 60 days of egress charges, which the UK Competition and Markets Authority considered “unlikely to be a sufficient period of time to complete a switch for many customers.”48 For EU workloads, the EU Data Act bars switching charges, including data egress charges, starting January 12, 2027.50
Here are U.S. median annual wages for the roles most often staffed on a migration.
Median Annual Wage for Roles Staffed on Cloud Migrations
| Role | Median Annual Wage, May 2025 (USD) |
|---|---|
| Database architects | $139,50022 |
| Software developers | $135,98023 |
| Computer network architects | $134,05024 |
| Information security analysts | $129,18025 |
| Database administrators | $104,62022 |
| Software quality assurance analysts and testers | $104,30023 |
| Network and computer systems administrators | $99,13026 |
Wages understate what a migration actually pays per hour. Clutch reports that U.S. cloud consulting firms bill $100 to $149 per hour on average.1
Migration Funding From the Cloud Providers
All three providers run programs that pay for part of the one-time cost, mostly the outside-services line that made up 17% to 53% of the component totals above. Google Cloud is the only one that publishes a formula. Its Rapid Migration and Modernization Program (RaMP) offers service funds for a partner or Google’s own professional services equal to 20% of the workload’s projected annual recurring revenue, capped at $2 million per workload, plus quarterly credits as tagged workloads grow. Oracle and SAP workloads may qualify for higher rates.37
Microsoft combined its migration offers into Azure Accelerate in July 2025. It includes partner funding, Azure credits, and Microsoft experts for hands-on deployment at no additional cost, and Microsoft describes it as having “no cap on investments” without publishing amounts.38 AWS’s Migration Acceleration Program likewise promises “financial investments” to “offset initial migration costs” without publishing figures.39
Google requires an assessment and workload tagging before its funds unlock, and AWS’s program starts with an assessment phase.37,39 Because the money is tied to how much you’ll spend with that provider, I’d finish your own cost model first and raise funding during the assessment, before any contract is signed.
In Practice
On a platform replacement for a Kansas City insurer (a repeat client), the original estimate was 18 to 24 months and 26 or more engineers. Two senior Keyhole consultants and nine client engineers set out to do it in about five months, and the case study reports the work on track for that.28 The constraint that shaped the approach was the AI tools’ context limits. The team kept daily story files outside the repositories and reloaded only the history each task needed, ran separate agents for database migrations, security analysis, service refactoring, and UI work, and compiled and tested after every phase.28
On one of our legacy modernization engagements, a COBOL batch conversion, AI-assisted code analysis and transformation cut manual development effort by 20 to 30 percent.29 I’ve only seen savings like that hold when architects define the boundaries first and every generated change passes the same tests the original system did.
Cloud Migration Cost Drivers
Flexera’s 2026 survey of 753 cloud decision-makers ranked the challenges organizations run into when moving workloads. The table below shows the share of respondents citing each one.
Top Cloud Migration Challenges (2026)
| Migration Challenge | Share of Respondents |
|---|---|
| Understanding application dependencies | 54%30 |
| Assessing technical feasibility | 44%30 |
| Assessing on-premises versus cloud costs | 43%30 |
| Selecting the best instance | 40%30 |
| Optimizing costs after migration | 39%30 |
Optimizing costs after migration dropped from the third-ranked challenge to fifth this year.30 These are challenges people reported, not measured cost impacts, and the survey doesn’t attach a dollar figure to any of them.
Overruns are common, and they aren’t small. McKinsey’s 2021 survey of nearly 450 CIOs and IT decision-makers found inefficiencies were “costing the average company 14 percent more in migration spend than planned each year,” that 38% of companies had seen migrations delayed by more than one quarter, and that overruns added up to “well more than $100 billion in wasted spend” globally over three years.31 Once workloads are running, 69% of 200 IT leaders surveyed by Gartner Peer Community reported cloud budget overruns, and Flexera’s 2025 survey found cloud budgets already exceeding limits by 17%.32,33
HashiCorp’s 2024 survey looked at where that excess spend comes from. Here are the top contributors to wasted cloud spend it found.
Top Contributors to Wasted Cloud Spend
| Contributor to Wasted Cloud Spend | Share of Respondents |
|---|---|
| Lack of needed skills (employee knowledge, training) | 41%34 |
| Over-provisioning of resources | 40%34 |
| Idle or underused resources | 35%34 |
| Inability to automate enforcement of policies and regulations | 35%34 |
| Lack of expiration dates on temporary cloud resources | 33%34 |
The survey was conducted by Forrester Consulting and covered nearly 1,200 practitioners and decision-makers. Of those, 91% reported wasted cloud spending, and 64% said they lack all the staff expertise their cloud infrastructure strategy needs.34 It measures waste in ongoing cloud operations, which includes newly migrated workloads but isn’t limited to them. Flexera separately estimates that wasted IaaS and PaaS spend rose to 29% in 2026, the first increase in five years.30
Public sector migrations have their own set of drivers. In June 2026, GAO counted the cloud procurement challenges cited by the 24 federal agencies covered by the Chief Financial Officers Act.
Cloud Procurement Challenges Cited by Federal CFO Act Agencies (2026)
| Procurement Challenge | Number of Agencies Citing (of 24) |
|---|---|
| Cloud cost control requiring changes to IT management | 1735 |
| Conflicting OMB and NIST software bill of materials guidance | 1735 |
| Outdated acquisition regulations | 1535 |
| Obtaining authorized cloud solutions | 1535 |
| Multi-vendor interoperability issues | 1135 |
| Workforce resource constraints | 1035 |
Agencies could report more than one challenge.35 GAO also noted that, based on its earlier work, estimated FedRAMP authorization costs “ranged anywhere from tens of thousands to millions of dollars,” a cost that commercial migrations outside regulated industries don’t carry.35
VMware Licensing Changes
For many organizations, the migration starts with a licensing bill. Rising virtualization license costs were the primary reason every organization in Forrester’s Nutanix study made its move.2 Broadcom’s changes to VMware licensing are the best-known example. From April 10, 2025, the minimum vSphere order went from 16 cores to 72, for renewals as well as new licenses.40 Gartner expects more than a third of workloads running on VMware to move to another platform by 2028, and warns that a full exit takes three or more years.41
Moving to a hosted VMware service doesn’t avoid the license. As of November 1, 2025, Microsoft no longer includes a VMware Cloud Foundation subscription with new Azure VMware Solution nodes, so customers buy it directly from Broadcom, and license-included pay-as-you-go deployments can run unchanged only through October 31, 2026.42 The Forrester figure for the Azure VMware Solution move covers one-time migration costs only, so a current budget for a move like that needs the Broadcom subscription accounted for separately.3,42
Rightsizing After the Move
Two of HashiCorp’s top contributors are over-provisioning and idle resources.34 In our experience, both usually trace back to sizing cloud workloads to match their on-premises specifications. Most of the fix is sequencing. Measure actual utilization for a few weeks before choosing instance sizes, rightsize again once the workload settles, and hold off on reserved capacity or savings plans until that second pass is done, since committing early locks in whatever over-provisioning is left.
How We Map Dependencies
Understanding application dependencies topped Flexera’s list, and it’s where we spend the most effort before anything moves.30 We pair automated code analysis with interviews of the people who run the systems, since they’re the ones who know which batch jobs and shared databases never made it into the documentation. Keyhole consultants average more than 17 years of experience, and 78% of our projects last year were with repeat clients.29,36
A One-Time Migration Budget Checklist
This table pulls every one-time line item discussed above into one place, along with what the published data says about each.
| Line Item | What the Published Data Shows |
|---|---|
| Assessment and dependency mapping | Top migration challenge in 2026, cited by 54% of respondents; not itemized in the Forrester studies2,3,4,30 |
| Internal staff labor | $90,000 to $2.4 million in the three Forrester studies, before risk adjustment2,3,4 |
| Outside services (systems integrator or vendor) | 17% to 53% of component totals; Gartner puts large VMware exits at $300 to $3,000 per VM2,3,4,5 |
| Training and change management | $700,000 for the 5,000-user SAP move; not itemized in the other two4 |
| Migration tooling | Free from all three providers, for a set period or for migrations in19,20,21 |
| Parallel running and replication infrastructure | Billed even during free tool periods; Azure Hybrid Benefit allows 180 days of license use in both places19,20,21,47 |
| Data transfer | Usually small; all three providers waive exit transfer fees, with conditions27,48,49 |
| Software licensing | Oracle vCPU rules, Microsoft license mobility, SQL Server 2016 security updates, and VMware subscriptions42,43,44,46 |
| Security review or re-accreditation | Estimated FedRAMP authorization costs range from tens of thousands to millions of dollars for federal work35 |
| Monitoring, runbooks, and on-call updates | Not itemized in any study we reviewed |
| Post-cutover tuning and rightsizing | Not itemized; over-provisioning and idle resources are among the top sources of wasted cloud spend34 |
| Provider funding (offset) | Google RaMP: 20% of projected annual recurring revenue, capped at $2 million per workload; AWS and Microsoft don’t publish amounts37,38,39 |
Concluding Thoughts
After going through this data, there are two budgeting decisions I’d make differently. I wouldn’t commit to a number until dependency mapping is done, and I’d choose the migration approach one application at a time, starting with the ones where a licensing change pays back quickly.
The exception is an estate that’s mostly VMs moving unchanged, with no rearchitecting. There, the per-VM figures in the first section are a reasonable starting point on their own.
If your estimate is still moving and the dependency picture is fuzzy, our senior, U.S.-based consultants can review the scope and the approach for each application. You can reach us at keyholesoftware.com/contact.
I’m also curious whether your migrations have followed the same pattern, especially the gap between the first estimate and the final number.
How Our Research Team Approached This
We compiled these figures in September and October 2026 from the 50 references listed below, 45 of them third-party sources. A few notes on how specific numbers were derived:
- In the project-size table, the three Forrester figures are risk-adjusted one-time costs, meaning Forrester added 15% to labor and services estimates (10% to training) to account for variation across the organizations it interviewed. They include internal staff time and external services, plus change management training for the SAP move, and exclude cloud subscription and run costs. The SAP total is our sum of Forrester’s three risk-adjusted initial cost lines: $4,140,000 in systems integrator fees, $2,815,200 in internal labor, and $770,000 in training.4
- The per-VM figures for the two Forrester composites are our calculations from the published totals and VM counts. Gartner’s range comes from its January 2025 report “Quick Answer: Estimating a Large-Scale VMware Migration,” as reported by Network World, and counts external services only. Internal staff and any new licenses or hardware are extra.5
- The Forrester timelines are reported durations. Forrester’s Nutanix study gives three months in its financial model and four in its executive summary; we use three.2 IDC’s 10.9 months is the deployment period used in its ROI model, and IDC’s own figure of $463,300 per migrated application covers migration, training, and Azure run costs over three years.6
- In the cost-reduction table, every row is a percent reduction as the source defined it, and the third column states what each percentage compares. AWS’s guidance discusses the Hackett figure alongside rehosting, but the study covers migrated applications generally.11
- In the cost breakdown, component rows are Forrester’s estimates before risk adjustment, and the risk adjustment row is our calculation of the difference between the component sum and Forrester’s risk-adjusted total. The Nutanix labor line is four full-time equivalents at 50% time for three months at a blended $15,000 per month. The Azure VMware Solution labor line combines planning (five senior staff, about 130 hours each, at $91 an hour) and migration (six IT staff, 520 hours each, at $55 an hour). The SAP labor line covers five project managers, 15 testers, and five SAP business analysts at 50% time for 18 months, and its external services line is $200,000 a month for 18 months.2,3,4
- Free-use periods for the native migration tools come from each provider’s pricing page as of September 2026, and the AWS exit window reflects AWS’s October 8, 2026 update. Azure Migrate discovery and assessment are also available “at no additional charge.”20,27
- Funding, licensing, and exit-fee terms come from each provider’s own pages as of October 2026. Google is the only provider that publishes a funding formula.37,38,39
- Wage figures are Bureau of Labor Statistics medians from the Occupational Outlook Handbook and exclude benefits and overhead. BLS doesn’t publish a separate occupation for cloud architects.
- The Flexera 2026 State of the Cloud Report is a global survey of 753 cloud decision-makers and users, published March 18, 2026.30
References
8. Amazon Web Services, “Guide for AWS Large Migrations: Introduction,” AWS Prescriptive Guidance
9. Keyhole Software, “Government Enterprise CI/CD Platform Modernization Case Study”
18. Keyhole Software, “Government Cloud, .NET & React Modernization Case Study”
19. Amazon Web Services, “AWS Transform MGN FAQs,” pricing
20. Microsoft Azure, “Azure Migrate Pricing”
21. Google Cloud, “Migrate to Virtual Machines 5.0 by Google Pricing”
28. Keyhole Software, “AI-Accelerated Development in Practice: A Repeat Client Modernization Story”
29. Keyhole Software, “Legacy System Modernization Services”
36. Keyhole Software, “Clients and Partners”
37. Google Cloud, “Rapid Migration & Modernization Program (RaMP),” accessed October 2026
39. Amazon Web Services, “AWS Migration Acceleration Program (MAP),” accessed October 2026
44. Microsoft, “Updated Microsoft Licensing Terms for Dedicated Hosted Cloud Services,” August 1, 2019
45. Microsoft Learn, “SQL Server 2016: Microsoft Lifecycle,” accessed October 2026
46. Microsoft Learn, “What Are Extended Security Updates for SQL Server?,” last updated June 22, 2026
47. Microsoft Azure, “Azure Hybrid Benefit Pricing,” accessed October 2026
More From Keyhole Software
About Keyhole Software
Expert team of software developer consultants solving complex software challenges for U.S. clients.
Share This Post
Join The Thousands Of Devs Who Subscribe
Discuss This Article
Subscribe
Login
0 Comments
Oldest