
Technical Debt Statistics: 2026 Benchmarks for Cost, Engineering Time, and AI-Era Accumulation
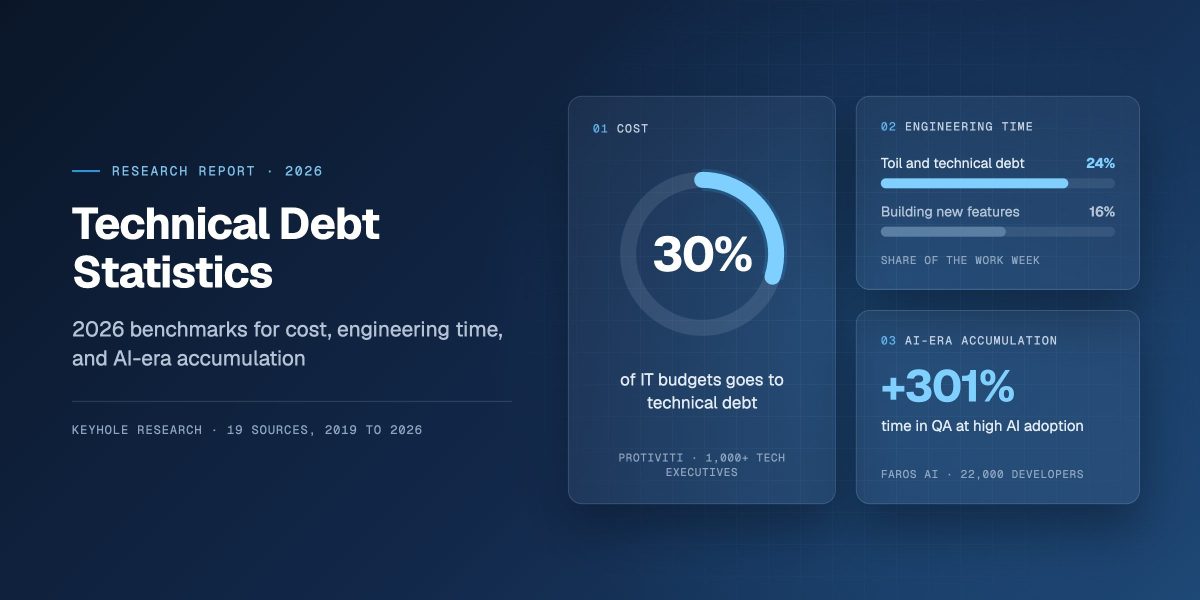
Technical debt consumes roughly 30% of IT budgets and about a quarter of the engineering week, and most organizations do not measure it. In 2026, AI coding tools have added a new variable: they speed up the start of the delivery pipeline and push the cost of weak review downstream into QA, incidents, and long-term maintenance.
In October 2026, the Keyhole research team compiled technical debt statistics from 19 third-party sources published between 2019 and September 2026: the Protiviti Global Technology Executive Survey of more than 1,000 technology executives, Deloitte’s March 2026 technical debt simulation, McKinsey’s 2020 CIO survey, the CISQ cost models for 2020 and 2022, the Sonar and Chainguard 2026 developer surveys, Atlassian’s 2025 developer experience survey of 3,500 developers, LinearB’s benchmarks built from 6.1 million pull requests, GAO’s 2025 assessment of 69 federal legacy systems, GitClear’s analysis of 623 million code changes, Faros AI telemetry from 22,000 developers, and peer-reviewed studies of production and public codebases.
We kept self-reported survey results separate from telemetry and from codebase analysis. We also label every table with the year of the dataset behind it, because the two most-quoted figures in this field are from 2020 and 2022 and are widely presented as current.
Below are the costs in budget and engineering time, where technical debt concentrates by industry, and how AI coding tools change the rate it builds up.
What Is Technical Debt?
Technical debt is the future cost of rework created by shortcuts, outdated components, and design decisions that make a system harder to change. In the research below it covers two related problems: aging legacy systems and platforms that are difficult to support, and code-level quality issues in systems of any age.
What Technical Debt Costs as a Share of IT Spending
The most useful way to size technical debt at the organizational level is as a share of the IT budget, because that is a number a CIO already controls and already reports. Three independent estimates made six years apart land in a similar place.
Technical Debt as a Share of IT Budget
| Population Measured | Share of IT Budget | How It Was Measured |
|---|---|---|
| Organizations worldwide¹ | 30% | Survey of more than 1,000 technology executives |
| Organizations in the United Kingdom¹ | 38% | Same survey, United Kingdom respondents |
| Transportation and logistics organizations¹ | 39% | Same survey, industry cut |
| S&P 500-scale organizations² | 21% to 40% | Deloitte baseline figure used in a simulation model |
| Financial services and technology companies above $1 billion in revenue³ | 10% to 20% | Share of the new-product budget diverted, 50 CIOs |
Methodology note: the first three rows come from the Protiviti Global Technology Executive Survey of more than 1,000 CIOs, CTOs, CISOs, and other technology executives worldwide. The Deloitte figure is the baseline input to a system dynamics model of 63 variables, not an observed result. The McKinsey figure measures something different from the others: budget diverted away from new products, rather than total spend on debt.
Caveat: the Protiviti survey does not state a fieldwork year on its published pages, and asset paths indicate 2023. The McKinsey range comes from 50 CIOs in two industries, all above $1 billion in revenue, surveyed in July 2020. We found no credible primary source breaking technical debt cost down by company size, so any figure presented that way should be treated with suspicion.
Budget share describes annual spend. The other common framing is accumulated principal, the estimated cost of fixing what has already been built.
Estimated Accumulated Technical Debt Principal
| Population and Year Measured | Estimated Principal | How It Was Measured |
|---|---|---|
| United States, 2022⁴ | $1.52 trillion | Static analysis estimates of effort to fix code weaknesses |
| United States, 2020⁵ | $1.31 trillion | Same model, prior edition |
| Global 2000 enterprises, 2025⁶ | $1.5 to $2 trillion | Analyst estimate, method not published |
Methodology note: CISQ builds its figure from static analysis estimates of the effort required to fix code weaknesses at release, adjusted for component complexity and system exposure. It is a cost model, not a survey. HFS Research publishes its range alongside a survey of more than 600 IT and business leaders but does not state how the range was derived.
Caveat: CISQ has published no edition after 2022, and the report attributes most of the increase from 2020 to inflation rather than to measured deterioration. The same report states it has no good estimate of the accumulating interest on technical debt, only the principal. These figures are national and Global 2000 aggregates, and they do not translate down to a single enterprise.
What This Means
Our analysis shows that the share of IT budget devoted to technical debt has not moved meaningfully in six years. Estimates made in 2020, in roughly 2023, and in 2026 all cluster around 30%. That consistency is the finding. It indicates that technical debt is not a problem organizations are solving over time, but one they are financing year after year.
The data also shows that the most actionable figure is the smallest one. McKinsey’s 10% to 20% of the new-product budget being diverted is the number that surfaces as missed roadmap commitments, and it is the one a finance partner will recognize, because it maps to work that was funded and did not ship.
In Practice
A usable remediation number usually comes from scoping a single system first rather than auditing the whole estate. An estate-wide audit produces figures much like the ones above:: directionally true, and too coarse to fund against. The organizations that get a usable remediation number scope one system and assess it in full. In Keyhole’s modernization engagements, the assessment phase has to produce a defensible estimate before anyone commits budget, and one system is the unit where that estimate holds up. Our guide to application portfolio prioritization covers how to decide which system goes first.
On an engagement for a business finance software company, a Keyhole senior consultant began with a standalone architectural assessment that produced estimates and recommendations for the highest-priority areas before any rebuild started, and the modernization followed as separate work. The assessment has to produce a defensible estimate before anyone commits budget, and a single system is the unit where that estimate holds up.
What Technical Debt Costs in Engineering Time
Time is where technical debt is felt, and it is the measure an engineering leader can verify internally without buying a report. Two 2026 surveys and one telemetry dataset describe it from different angles.
Share of the Engineering Work Week
| Activity Measured | Share of Work Week | How It Was Measured and Who |
|---|---|---|
| Toil work, including managing technical debt and debugging legacy code⁷ | 24% | Survey of 1,149 developers, fielded October 2025 |
| Writing code and building new features⁸ | 16% | Survey of 1,200 engineers and technology leaders, fielded August 2025 |
| Keeping the lights on⁹ | 10% | Telemetry, 6.1 million pull requests across 3,026 organizations |
Methodology note: the three sources define their categories differently, which is why they appear as separate rows rather than a single total. Sonar defines toil in the question itself as managing technical debt and debugging legacy or poorly documented code. LinearB’s engineering investment profile splits effort into new value 55%, feature enhancement 20%, developer experience 15%, and keeping the lights on 10%.
Caveat: the first two rows are self-reported, and self-reports of time are unreliable in both directions. The third is telemetry but is drawn from LinearB’s own customer base rather than a representative industry sample. None of the three isolates technical debt from maintenance work generally.
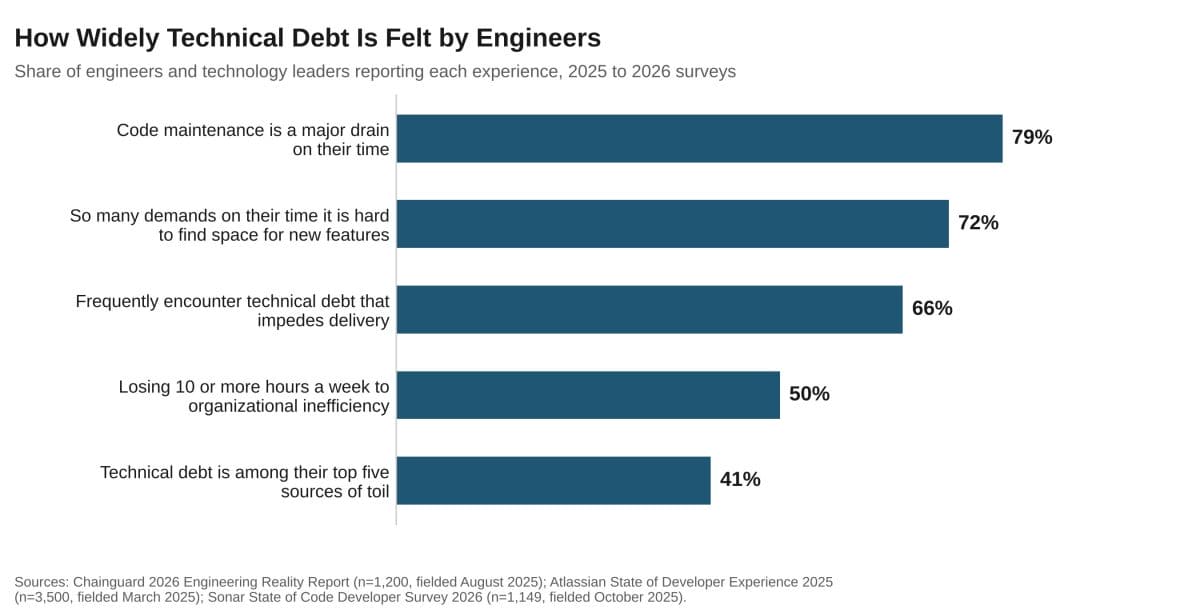
Self-reported time is one view. How many engineers feel the problem at all is another, and the agreement across surveys is stronger there.
Share of Engineers Reporting Each Form of Friction
| Reported Experience | Share of Respondents | How It Was Measured and Who |
|---|---|---|
| Code maintenance is a major drain on their time⁸ | 79% | Survey of 1,200, fielded August 2025 |
| So many demands on their time that it is hard to find space for new features⁸ | 72% | Same survey |
| Frequently or very frequently encounter technical debt that impedes delivery⁸ | 66% | Same survey |
| Losing 10 or more hours a week to organizational inefficiency¹⁰ | 50% | Survey of 3,500 developers, fielded March 2025 |
| Managing technical debt is among their top five sources of toil⁷ | 41% | Survey of 1,149 developers, fielded October 2025 |
Methodology note: the Chainguard survey split its 1,200 responses evenly between software engineers and senior technology leaders across the United States, United Kingdom, Germany, and France. The Atlassian survey was fielded by Wakefield Research across six countries with a margin of error of 1.66 points.
Caveat: the Atlassian figure attributes lost hours to organizational inefficiency broadly, not to technical debt specifically. In the same report, technical debt fell from the first-ranked friction in 2024 to sixth in 2025, a rank change the report publishes without an accompanying percentage.
Surveys measure how the problem feels. Codebase analysis measures what it does.
Measured Effect of Low Code Quality on Delivery
| Measure | Difference Versus High Quality Code |
|---|---|
| Defect count¹¹ | 15 times more |
| Time to resolve an issue¹¹ | 124% more time |
| Maximum issue resolution cycle time¹¹ | 9 times longer |
Methodology note: the study combined source code analysis, version control mining, and issue tracker data across 39 proprietary production codebases, and classified code quality using a commercial static analysis tool.
Caveat: the study’s own introduction cites a separate 2018 estimate that technical debt wastes up to 42% of developer time. That 42% figure belongs to the earlier report, not to this study, and it is frequently misattributed.
What This Means
Our analysis shows that roughly a quarter of the engineering week is the defensible figure for toil and maintenance, and that the gap between that and the 16% spent building new features is where the case for remediation lives. An organization paying for 100 engineers is funding the equivalent of 24 people to service debt and 16 to build the product.
The data also shows that the predictability cost is larger than the average cost. A 124% increase in resolution time is a budgeting problem. A 9 times longer maximum cycle time is a forecasting problem, and it is the one that makes roadmaps slip in ways that look like a people issue and are not.
In Practice
Codebase analysis belongs before the estimate, not after it. The difference between high and low quality code is the difference between a 3 to 6 month replatforming and a 12 to 24 month rearchitecture, which are the timeline ranges.
Code quality is one of the largest factors in where a system lands in that range, alongside dependencies, data structures, and regulatory constraints. A team that estimates before measuring is guessing across a factor of four. Our 6-step framework for estimating software development time and legacy system assessment checklist cover what to measure first.Code quality sets the timeline; the estimate only reveals it.
Where Technical Debt Concentrates by Industry and in Legacy Estates
Technical debt is not evenly distributed. Regulated industries running long-lived transaction systems report the heaviest impact, and the public sector provides the only fully public, independently audited record of what deferred modernization produces.
Technology Executives Reporting High Impact of Technical Debt on Innovation, by Industry
| Industry | Share Reporting High Impact |
|---|---|
| Biotechnology and medical devices¹ | 82% |
| Telecommunications¹ | 81% |
| Financial services¹ | 78% |
| Healthcare provider services¹ | 66% |
Methodology note: this is the same Protiviti survey used in the first section. It measures executives’ assessment of impact on their ability to innovate, not spending and not code quality.
Caveat: perceived impact varies with how closely an industry tracks the problem, so these figures partly measure attention. Only one industry-level budget figure exists in the data, 39% for transportation and logistics, which appears in the first section rather than here because it is a different metric.
Perception data has limits. The federal government publishes audited findings on specific systems, which is the closest thing to a controlled look at what happens when modernization is deferred for decades.
Condition of the 11 U.S. Federal Legacy Systems Identified as Most in Need of Modernization
| Condition Found | Number of Systems |
|---|---|
| Use outdated programming languages¹² | 8 of 11 |
| Have known cybersecurity vulnerabilities¹² | 7 of 11 |
| Run unsupported hardware or software¹² | 4 of 11 |
| Have no documented modernization plan¹² | 2 of 11 |
Methodology note: GAO assessed 69 federal legacy systems across 10 agencies in its July 2025 report and identified the 11 most critical. The two systems with no modernization plan were at the Departments of Defense and Energy.
Caveat: these 11 systems were selected because they were the most in need of modernization, so they are not representative of federal IT generally. The federal estate is also subject to appropriations cycles that private organizations do not face.
The scale behind those 11 systems is the part worth stating plainly. The federal government spends more than $100 billion a year on IT, and agencies have typically reported about 80% of that going to operating and maintaining existing systems rather than building new ones.12 GAO has published that same 80% figure since at least 2019.13 Of the 10 critical systems GAO flagged in June 2019, three modernizations were complete by its 2025 follow-up.12
What This Means
Our analysis shows that the industries reporting the heaviest impact are the ones where the cost of a failed change is highest, which is also where the incentive to defer change is strongest. Deferral is rational at each individual decision point and expensive in aggregate, and the federal 80% figure is what that aggregate looks like after several decades.
The data also shows a measurement gap that cuts across industries. Only 6% of technology organizations have a process in place to track and report technical debt, a lower rate than any other industry in the same survey.1 Organizations are financing a cost most of them do not measure.
In Practice
In our experience, the binding constraint in regulated environments is that the system cannot be taken offline for the length of a rewrite. That rules out a big-bang replacement and favors phased migration with parallel running, which costs more in the short term and is often the only approach the business can absorb. Keyhole’s KC Southern modernization, which replaced a Visual Basic 6 and COBOL estate running train operations, financials, and mechanical systems with .NET Core microservices deployable on-premise and in Azure, is one example of modernizing a system the business could not pause.
Encapsulation, wrapping a legacy system in modern APIs, deserves a specific warning. Keyhole has provided modernization solutions to more than 100 clients across 18 major industries, and encapsulation is the one approach we flag explicitly. It is useful when speed to market is the constraint, but it solves an integration problem without eliminating technical debt, and a mainframe behind a REST API can still become a bottleneck under load. Our guide to legacy modernization approaches and modernization sequencing strategy cover how to choose and order these options.
How AI Coding Tools Are Changing the Rate of Accumulation
The question for 2026 is not whether AI coding agents produce usable code. It is whether the code accumulates debt faster than teams retire it. The evidence is mixed, and which answer you get depends on what was measured.
Change in Code-Quality Indicators Since 2023
| Indicator | Change |
|---|---|
| Code block duplication¹⁴ | +81% |
| Error-masking constructs¹⁴ | +47% |
| Within-commit copy and paste¹⁴ | +41% |
| Two-week code churn¹⁴ | +15% |
| Function connectivity¹⁴ | -35% |
| Refactoring moves¹⁴ | -70% |
| Long-term updates to older code¹⁴ | -74% |
Methodology note: GitClear defines a duplicated block as five or more consecutive repeated meaningful lines, and measures moved code as a proxy for refactoring. The comparison baseline is 2023, with some series extending back to 2022.
Caveat: GitClear sells developer analytics and draws on its own customers’ repositories. Its published page states duplication per million changed lines in the body text and per thousand changes in the chart caption, so we have used only the relative change. Correlation with the AI adoption curve is not evidence that AI caused these movements.
Telemetry measures the code. Surveys measure what the people writing it observed.
Developers Reporting Each Negative Effect of AI on Technical Debt
| Reported Effect | Share of Respondents |
|---|---|
| Created code that looked correct but was not reliable⁷ | 53% |
| Created unnecessary or duplicative code⁷ | 40% |
| Created unreliable or buggy code⁷ | 29% |
| Created code that was difficult to maintain or refactor⁷ | 27% |
| Introduced integration or compatibility issues⁷ | 21% |
| Increased security vulnerabilities⁷ | 17% |
| Produced poor or no documentation⁷ | 14% |
Methodology note: respondents could select more than one effect. In the same survey, 88% reported at least one negative effect of AI on technical debt and 93% reported at least one positive effect, with improved documentation at 57% and improved test coverage at 53%.
Caveat: the survey required respondents to have used AI at work in the past year, so it does not describe developers who have not adopted these tools. The same report notes that 75% of developers said AI reduces their toil, while measured toil stayed flat at 23% to 25% of the week regardless of how often they used AI.
Code quality and developer perception both point at the same place. Delivery telemetry shows where the cost lands.
Change in Delivery Metrics at High AI Adoption
| Metric | Change |
|---|---|
| Time in QA¹⁵ | +300.6% |
| Monthly incidents¹⁵ | +125.4% |
| Average pull request size¹⁵ | +71.8% |
| Pipeline restarts¹⁵ | +66.7% |
| Incidents per pull request¹⁵ | +14.5% |
Methodology note: Faros AI compares outcomes at high versus low AI adoption within the same organizations, using the most recent 12 months of telemetry. In the same dataset, 79% of developers use at least one AI tool weekly and acceptance of AI-generated code has reached 65%.
Caveat: incidents per pull request rose 242.7% in the prior quarter’s dataset and 14.5% in this one, so the series is volatile and the direction matters more than the magnitude. Faros sells developer analytics, and its public pages give no absolute values.
Not all of the evidence runs the same way.
- A study of 19,816 AI-involved code files across 12,749 commits in public repositories found that human-written code was more duplicated than AI-generated code on every major measure, 27.57% of lines against 14.29%, and triggered more static analysis alerts per thousand lines, 13.56 against 10.04.16
- The same study found the cost appears later rather than at commit time, with AI-involved code requiring more follow-up modification and showing a handoff latency of 28.28 days against 11.23 days.
- A separate analysis of 3,858 pull requests found the opposite on redundancy, with AI agents at an average maximum redundancy of 0.2867 against 0.1532 for humans.17
Security testing tells a similar story. In Veracode’s summer 2026 round, 11 new models across 80 coding tasks ranged up to a 68% security pass rate, with Java the weakest language at 30%; across more than 100 models tested over four years, the average pass rate has held near 56%.18 Veracode tested raw model output with no security prompts, guardrails, or human review, so these rates describe unreviewed code, not code in production. Veracode sells application security tools.
Google’s 2025 DORA research, based on nearly 5,000 respondents surveyed between June 13 and July 21, 2025, found that AI adoption now improves delivery throughput, a reversal from the prior year, while still increasing delivery instability.19
What This Means
The disagreement between these datasets is informative rather than noise. The telemetry studies measure codebases where AI tooling was adopted at organizational scale and review practice did not change with it. The repository study measures AI-attributed code in public projects, where contributions were reviewed before they landed. Read together, they point to review and governance as the variable that separates favorable results from unfavorable ones. That is our interpretation, not a tested finding: the studies also differ in how they attribute code to AI and in what they count.
The data also shows one pattern that holds across every source, including the favorable one: the cost moves later in the lifecycle. Pull requests get larger, review gets lighter, QA time grows, and stabilization stretches out. A team measuring only merge velocity will record an improvement while accumulating debt faster than before.
In Practice
AI acceleration is not appropriate for every system, and that judgment belongs in the assessment phase rather than in the middle of delivery. Where Keyhole applies it, output is validated through automated tests, architectural review, and controlled commits rather than accepted on review confidence.
Two engagements show what that looks like in practice. On a COBOL to Spring Batch proof of concept for a wholesale food distributor, AI-assisted code analysis and transformation reduced manual development effort by 20% to 30%. On a platform replacement for a Kansas City pet insurer, two senior Keyhole consultants introduced architect-led, AI-accelerated workflows for the client’s own team, and a project originally estimated at 18 to 24 months was completed in about five. Neither result came from the tools alone. Both depended on the testing and review discipline around them, which is the same variable the research points to.
Our article on how enterprise teams get repeatable results from AI-assisted development covers the workflow in detail, and The Impact of AI on Software Development reviews the broader productivity research.
What Technical Debt Statistics Mean for 2027 Planning
Three findings in this data should change how a technology leader plans for next year.
- Technical debt has held near 30% of IT spend in two surveys three years apart. The current approach is maintaining the problem, not reducing it.
- The predictability cost of degraded code is the bigger planning risk. A maximum resolution time nine times longer than in healthy code is rarely modeled, and it is what breaks delivery forecasts.
- The AI effect on debt tracks review discipline more closely than tool choice. That makes it one of the few variables in this data directly within a technology leader’s control.
For teams turning that into a plan:
- Measure one system in full before funding remediation: code quality, dependency health, defect resolution times, and change frequency.
- Track engineering time from both sides. Pair pull request telemetry with a short engineer survey; the gap between them is where unmeasured debt lives.
- Set AI guardrails before scaling adoption: pull request size limits, required review on every merge, and time in QA watched as an early warning.
- Fund remediation as a recurring line tied to the systems the roadmap depends on, rather than a one-time cleanup.
The organizations in better shape a year from now will be the ones measuring debt before it becomes urgent. For teams deciding where to start, the practical unit is one system assessed in full, because that is the level at which a remediation estimate can be defended and funded. If you’re evaluating where technical debt is constraining your roadmap, Keyhole’s legacy system modernization team can help turn that assessment into a sequenced, fundable plan.
Frequently Asked Questions
What percentage of the IT budget goes to technical debt? About 30% on average, according to Protiviti’s 2023 survey of more than 1,000 technology executives. Deloitte’s 2026 Global Technology Leadership Study estimates 21% to 40%.
How much developer time is spent on technical debt? Roughly a quarter of the work week. Sonar’s survey of 1,149 developers found 24% of time goes to toil, including managing technical debt and debugging legacy code.
Does AI-generated code increase technical debt? The evidence is mixed. Telemetry from organizations at high AI adoption shows more duplication, larger pull requests, and more incidents, while studies of reviewed code show smaller or reversed differences. Review practice appears to be the deciding factor.
How much technical debt exists in the United States? CISQ estimated $1.52 trillion in accumulated principal in 2022, its most recent edition. That figure covers the cost to fix existing code weaknesses, not the ongoing interest.
References
- Protiviti, “Global Technology Executive Survey: Tech Debt a Major Burden,” survey of more than 1,000 CIOs, CTOs, CISOs and other technology executives worldwide, year not stated on the published page
- Deloitte Center for Integrated Research, “The Hidden Drag, Quantified: Technical Debt’s Penalty on Value and Growth,” system dynamics simulation of 63 variables, March 27, 2026
- McKinsey Digital, “Tech Debt: Reclaiming Tech Equity,” survey of 50 CIOs of financial services and technology companies with revenues above $1 billion, fielded July 2020, October 6, 2020
- Krasner, H., CISQ, “The Cost of Poor Software Quality in the US: A 2022 Report,” November 2022
- CISQ, “The Cost of Poor Software Quality in the US: A 2020 Report,” 2020
- HFS Research and Publicis Sapient, “New Report Underscores Need for AI-Driven Modernization to Tackle $2 Trillion Tech Debt,” survey of more than 600 IT and business leaders globally, May 8, 2025
- Sonar, “State of Code Developer Survey Report 2026,” survey of 1,149 developers, fieldwork October 2025
- Chainguard, “2026 Engineering Reality Report,” survey of 1,200 respondents split between software engineers and senior technology leaders, fieldwork August 2025
- LinearB, “2025 Software Engineering Benchmarks Report,” 6,100,878 pull requests across 3,026 organizations and 167,437 contributors
- Atlassian, “State of Developer Experience Report 2025,” survey of 3,500 developers and managers by Wakefield Research, March 13 to 23, 2025, July 9, 2025
- Tornhill, A., and Borg, M., “Code Red: The Business Impact of Code Quality,” 39 proprietary production codebases, 30,737 files, arXiv:2203.04374, March 8, 2022
- U.S. Government Accountability Office, “Information Technology: Agencies Need to Plan for Modernizing Critical Decades-Old Legacy Systems,” assessment of 69 federal legacy systems across 10 agencies, GAO-25-107795, July 17, 2025
- U.S. Government Accountability Office, “Information Technology: Agencies Need to Develop Modernization Plans for Critical Legacy Systems,” GAO-19-471, June 11, 2019
- GitClear, “Write-Only Mode: AI Code Quality in 2026,” 623 million analyzed code changes from 2023 to 2026, September 2026
- Faros AI, “The Speed Trap,” AI Engineering Report Q3 2026, most recent 12 months of telemetry from 22,000 developers across 4,000 teams, September 18, 2026
- Mao, Zhao, Tang, Wang, and Zhang, “A Large-Scale Comprehensive Measurement of AI-Generated Code in Real-World Repositories,” 19,816 AI-involved files across 12,749 commits, arXiv:2603.27130, July 1, 2026
- Huang, Jaisri, Shimizu, Chen, Nakashima, and Rodríguez-Pérez, “More Code, Less Reuse: Investigating Code Quality and Reviewer Sentiment Towards AI-Generated Pull Requests,” 3,858 pull requests, arXiv:2601.21276, January 29, 2026
- Veracode, “2026 GenAI Code Security Report,” 11 models tested across 80 tasks, summer 2026 dataset
- DORA, Google, “State of AI-Assisted Software Development 2025,” survey of nearly 5,000 technology professionals conducted June 13 to July 21, 2025, September 2025
- Keyhole Software, “Legacy System Modernization Services”
- Keyhole Software, “Clients and Partners”
More From Keyhole Software
About Keyhole Software
Expert team of software developer consultants solving complex software challenges for U.S. clients.
Share This Post
Join The Thousands Of Devs Who Subscribe

Discuss This Article
Subscribe
Login
0 Comments
Oldest