
Developer Productivity Metrics: 2026 Benchmarks by Team Size and Industry
Developer productivity metrics are everywhere in 2026, and they rarely agree. DORA’s elite teams ship a change in under a day, LinearB’s elite pull requests reach production in under 25 hours, and the AI studies range from a 39% output gain to a 19% slowdown. So which number should your team chase?
Our view: none of them, at least not first. The headline tiers matter less than where your own pipeline stalls, and in most organizations we work with, the stall is not in the editor.
In October 2026, the Keyhole research team compiled developer productivity benchmarks from 25 third-party sources published between 2024 and October 2026: the DORA 2024 and 2025 reports, LinearB’s 2026 benchmarks (8.1 million pull requests), DX’s Core 4 benchmarks and quarterly AI impact reports (500+ engineering organizations), CircleCI’s 2025 and 2026 State of Software Delivery reports (42.9 million CI workflows), U.S. Census Bureau and Federal Reserve surveys, the Stack Overflow 2026 Developer Survey, and field experiments at Microsoft, Google, and METR. Each benchmark table is labeled with the year of its dataset and holds one metric in one unit.
Below are the core developer productivity benchmarks, how they change by team size and industry, what AI coding agents are doing to them, and the steps we would take to set your own targets.
Core Developer Productivity Benchmarks: DORA Metrics and Pull Request Cycle Time
The most widely used developer productivity metrics are DORA’s four key metrics: change lead time, deployment frequency, change failure rate, and failed deployment recovery time.1
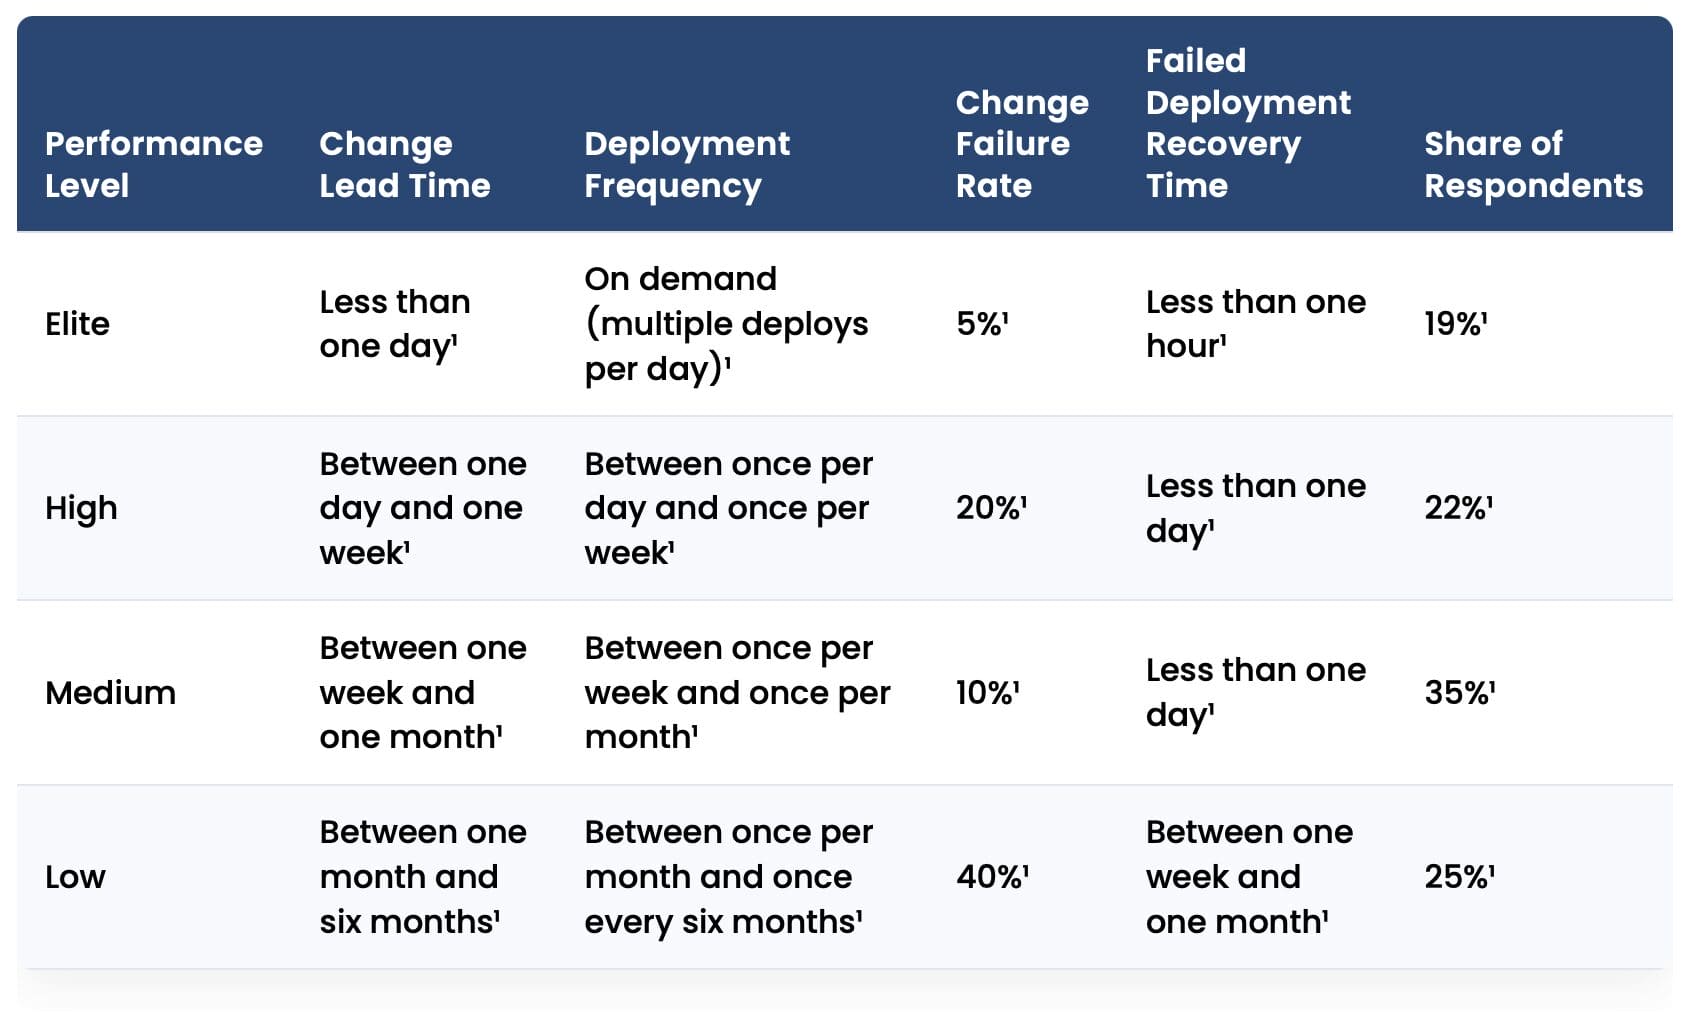
The table below shows the performance levels from the 2024 report, the most recent DORA edition to publish them; the 2025 report describes seven team profiles instead and does not restate the thresholds.1,2 The short answer: elite teams deploy on demand, ship a change in under a day, see failures on about 5% of changes, and recover in under an hour.1
Software Delivery Performance Levels: DORA Four Key Metrics (2024)
| Performance Level | Change Lead Time | Deployment Frequency | Change Failure Rate | Failed Deployment Recovery Time | Share of Respondents |
|---|---|---|---|---|---|
| Elite | Less than one day¹ | On demand (multiple deploys per day)¹ | 5%¹ | Less than one hour¹ | 19%¹ |
| High | Between one day and one week¹ | Between once per day and once per week¹ | 20%¹ | Less than one day¹ | 22%¹ |
| Medium | Between one week and one month¹ | Between once per week and once per month¹ | 10%¹ | Less than one day¹ | 35%¹ |
| Low | Between one month and six months¹ | Between once per month and once every six months¹ | 40%¹ | Between one week and one month¹ | 25%¹ |
Methodology note: DORA derived the four clusters from survey responses of nearly 3,000 professionals fielded in early 2024; the four columns are read together, since a level is set by all four thresholds, and the medium cluster’s 10% change failure rate is reproduced as published.1
Caveat: these are self-reported survey values, not telemetry, and because the 2025 report (nearly 5,000 respondents) published no replacement, the thresholds are now more than two years old.1,2
Teams that measure at the pull request level use cycle time, the hours from first commit to production. The table below gives LinearB’s 2026 tiers for each phase and for total cycle time, in hours, at the 75th percentile.
Pull Request Cycle Time Benchmarks by Phase, 2026 (Hours)
| Cycle Time Phase | Elite | Good | Fair | Needs Focus |
|---|---|---|---|---|
| Coding time (first commit to pull request published) | Under 54 minutes³ | 54 minutes to 4 hours³ | 5 to 23³ | Over 23³ |
| Pickup time (pull request waits for a reviewer) | Under 1³ | 1 to 4³ | 5 to 16³ | Over 16³ |
| Review time (review start to merge) | Under 3³ | 3 to 14³ | 15 to 24³ | Over 24³ |
| Deploy time (merge to release) | Under 16³ | 16 to 106³ | 107 to 277³ | Over 277³ |
| Total cycle time (code to production) | Under 25³ | 25 to 72³ | 73 to 161³ | Over 161³ |
Methodology note: LinearB built its 2026 tiers from 8,109,244 pull requests across 4,813 teams in 42 countries; Elite is the top 10% of organizations, Good the top 30%, Fair the top 60%, and Needs Focus the bottom 40%.3
Caveat: start-ups with up to 200 employees are 59.7% of the sample, and LinearB removed mean time to restore from the 2026 benchmarks “because the underlying data variance is too large.”3
What This Means
Our analysis shows the benchmarks agree on the shape of high performance: DORA’s elite cluster deploys on demand with a lead time under a day, LinearB’s elite tier moves a pull request from first commit to production in under 25 hours, and DX’s top-quartile technology companies under 100 engineers merge 4.67 pull requests per engineer per week.1,3,4 The slack sits after the merge: in LinearB’s tiers the deploy phase is the longest at every level, 16 to 106 hours in the Good tier against 3 to 14 hours for review.3
In Practice
In our experience, the most useful first step is to measure the full pipeline, not just the coding phase. On a government CI/CD platform modernization, a Keyhole team of five architects and a project manager consolidated the build and release pipelines for 400 to 500 applications onto a shared platform and cut time-to-deployment by more than 30%.5 The gain came from the release pipeline rather than the coding phase, which is exactly where the benchmarks say the slack is. (For the underlying practices, see our guide to implementing CI/CD pipelines for enterprise DevOps.)
Questions to answer this quarter:
- What is our total cycle time from first commit to production, split into coding, pickup, review, and deploy?
- Which phase is longest, and which LinearB tier does it fall in?
- How many of our pipelines are hand-built, and could they share one library?
- Who owns the pipeline, and is that person measured on time-to-deployment?
Developer Productivity Benchmarks by Team Size
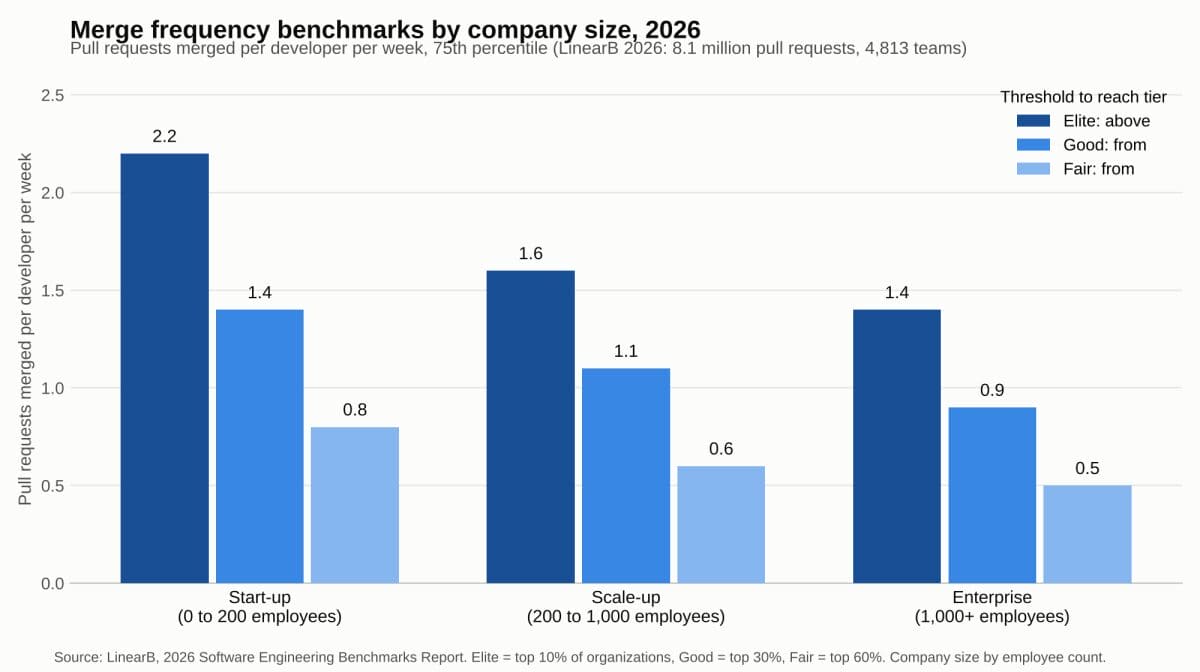
Very few datasets report developer productivity metrics by team size, meaning developers per team; the largest publishers segment by engineering organization size (developers) or company size (employees). The table below gives LinearB’s 2026 cycle time tiers by company size, in hours. The short answer: start-ups and enterprises share about the same elite threshold, and scale-ups are the slowest segment at every tier.
Pull Request Cycle Time Benchmarks by Company Size, 2026 (Hours)
| Company Size (Employees) | Elite | Good | Fair | Needs Focus |
|---|---|---|---|---|
| Start-up (0 to 200) | Under 25³ | 25 to 71³ | 72 to 164³ | Over 164³ |
| Scale-up (200 to 1,000) | Under 45³ | 45 to 95³ | 96 to 169³ | Over 169³ |
| Enterprise (1,000+) | Under 27³ | 27 to 89³ | 90 to 165³ | Over 165³ |
Methodology note: same dataset and 75th percentile aggregation as above; LinearB segments by company employee count, not developer headcount.3
Caveat: enterprises are 15.8% of LinearB’s organizations, so their thresholds rest on a smaller group.3
What This Means
Size changes the cycle time benchmark less than most leaders expect, and that the middle is the hard place. The elite threshold is 25 hours for start-ups and 27 for enterprises, but 45 for scale-ups.3
Merge frequency, shown in the chart above, follows the same order: an Elite start-up merges more than 2.2 pull requests per developer per week, an Elite scale-up more than 1.6, and an Elite enterprise more than 1.4.3 DX, which segments by engineers rather than employees, shows a flatter decline, from a median of 3.8 pull requests per engineer per week at technology companies under 100 engineers to 3.35 at 2,500 or more; its complexity-weighted Q2 2026 measure drops from about 2.2 at 15 to 99 engineers to 1.2 at 750 or more.4,6
Read together, the data says larger organizations do not necessarily ship slower; they ship less per engineer. The time a change spends in the pipeline is similar, but more of each engineer’s week goes to coordination, dependencies, and review of other people’s work.
CircleCI, the one dataset that segments by contributors per team, shows the same pattern in recovery: teams with 2 to 5 contributors repair a failed main-branch build in 50 minutes, teams with 1,000 or more in 33 minutes, and teams with 21 to 50 in more than 150 minutes.7
The pattern is familiar from engagements. Small teams recover fast because everyone knows the code. Very large organizations recover fast because they have invested in platform engineering, ownership rules, and on-call rotations. Mid-sized teams have outgrown the first model and have not yet built the second, so a broken build waits for someone to decide it is theirs.
In Practice
In our experience, the most common mistake is staffing to a headcount target instead of a seniority target. The data above shows size moves cycle time less than leaders expect, so the better question is how much of the team can work without supervision.
On a Kansas City insurance platform replacement, two senior Keyhole consultants working with nine client engineers, using AI coding agents inside architect-defined rules, delivered a full system replacement in approximately 5 months against an estimate of 18 to 24 months and 26 or more engineers.8,9 The AI could not commit or push without human approval, and the team validated after each phase.8 That is the pattern Keyhole staffs for: consultants average 17 or more years of experience and nearly 5 years with the company, all as full-time employees.10
Headcount adds capacity. Seniority reduces the waiting between people.
Developer Productivity Benchmarks by Industry
Industry is the dimension buyers ask about most and the one the data supports least. DORA’s 2024 report states that “our research rarely finds that industry is a predictor of software delivery performance; we see high-performing teams in every industry vertical,” and LinearB, DX, Jellyfish, and Faros AI publish no delivery metrics by industry.1 The one telemetry dataset that does is CircleCI’s. The table below gives the median time to recover a failed main-branch CI workflow, in minutes, for the industries Keyhole serves most often (September 2024 data), with the time the fastest 5% of teams needed.
Median Time to Recover a Failed Main-Branch CI Workflow by Industry (Minutes)
| Industry | Median | Fastest 5% of Teams |
|---|---|---|
| Internet Software & Services | 59.9¹¹ | 0.8¹¹ |
| Capital Markets | 81.8¹¹ | 1.9¹¹ |
| Diversified Financial Services | 98.4¹¹ | 3.5¹¹ |
| Insurance | 134.7¹¹ | 3.9¹¹ |
| Banks | 137.2¹¹ | 6.7¹¹ |
| Automotive | 384.8¹¹ | 77.6¹¹ |
| Retailing | 405¹¹ | 15.9¹¹ |
| Health Care Equipment & Supplies | 810.2¹¹ | 703.5¹¹ |
Methodology note: CircleCI analyzed 14,146,319 workflows run September 1 to 28, 2024; the median across all organizations was 63.8 minutes, and industry labels come from Clearbit and are “not available for all organizations.”11
Caveat: this is CI recovery time on one vendor’s platform, not DORA’s failed deployment recovery time, and it is rising: by September 2025 the median had climbed from 59.9 to 96.9 minutes in computer software and from 81.8 to 471.3 in capital markets, which CircleCI attributes to AI-generated changes that “reach deeper into their systems.”7
Delivery telemetry by industry is thin, but the Census Bureau measures how much each sector applies generative AI to software work. The table below shows the share of generative-AI-using businesses that apply it to software coding or debugging, by sector.
Share of Generative-AI-Using Businesses That Apply It to Software Coding or Debugging, by Sector (2026)
| Sector | Share of Generative-AI-Using Businesses |
|---|---|
| Information | 34.2%¹² |
| Professional, Scientific, and Technical Services | 23.7%¹² |
| Manufacturing | 16.0%¹² |
| Finance and Insurance | 8.1%¹² |
| Transportation and Warehousing | 6.8%¹² |
| Health Care and Social Assistance | 4.4%¹² |
| All sectors | 12.7%¹² |
Methodology note: the Business Trends and Outlook Survey AI supplement was collected November 17, 2025 to February 8, 2026; the shares are among businesses that reported using generative AI, so they describe the task mix of adopters, and sectors are named with standard NAICS titles.12,13
Caveat: coding is a minority use in every sector; nationally, 85.4% of generative-AI-using businesses apply it to writing and 12.7% to coding.12
What This Means
Our analysis shows that industry predicts how much AI a sector applies to code, but not how well its teams deliver. The spread inside a sector dwarfs the spread between sectors: the fastest 5% of bank teams recover in 6.7 minutes against a bank median of 137.2, a 20-fold gap, while the bank and insurance medians differ by under 3 minutes.11
For a buyer, this is the most practical finding in the piece: “we’re a bank” or “we’re regulated” explains very little about why a team is slow. Practices explain far more than vertical.
Where industry does show up is in the AI payoff, which follows the adoption order. The St. Louis Fed puts the share of work hours saved by generative AI in Q2 2026 at 4.85% in the Information sector, 3.29% in finance and insurance, and 1.49% in health care, against 2.17% for all workers and 4.80% for computer and mathematical occupations in every industry.14,15,16,17,18
In Practice
In our experience, the industry effect lives in the review and release gates, not in the code, and the gates are where modernization pays off. For a provincial government agency, Keyhole embedded one senior full-stack developer in a hybrid vendor-government Scrum team, replatformed .NET Framework 4.6.1 to .NET 8, and moved release cadence from quarterly to weekly while cutting Windows Server licensing costs by 60%.19 On DORA’s 2024 scale, that is a move from the low cluster to the high cluster.1
In a regulated environment, the gate is the constraint, so the gate is what we automate and test first. Approvals do not go away; they become policy checks and test evidence the pipeline can produce on every run.
Questions for your release process:
- Which release gates still depend on a person running a checklist?
- Which of those could become automated tests or policy checks?
- How long does a failed build take us to recover, compared with our industry median in the CircleCI table?
- What is blocking weekly releases: the code, the approvals, or the environments?
The Impact of AI Coding Assistants and Agents on Developer Productivity
AI coding tools are in use by about 9 in 10 developers, so every benchmark above already reflects them: 90% of DORA’s respondents used AI at work in mid-2025, DX measured 93% adoption across close to 500 companies, and 73% of Stack Overflow’s 30,903 respondents in 2026 use coding assistants and agents daily.2,20,21
The table below lists the measured effect on developer output from the studies we could verify at the source. The short answer: field studies at Microsoft, Google, and Cursor’s customers cluster between 21% and 39% more output, and the one randomized trial with experienced open-source developers found a 19% slowdown.
Measured Change in Developer Output with AI Coding Tools, by Study
| Study | Measured Change | What Was Measured and Who |
|---|---|---|
| Microsoft, early-2026 rollout of Claude Code and GitHub Copilot CLI (2026) | +24% merged pull requests²² | Telemetry vs. estimated counterfactual, tens of thousands of engineers, four months |
| Cursor and the University of Chicago (2025) | +39% merged pull requests²³ | Companies after Cursor’s agent became the default |
| Cui et al., Microsoft, Accenture, and a Fortune 100 firm (2025) | +26.08% completed tasks²⁴ | Three field experiments, 4,867 developers |
| Google internal randomized trial (2024) | About 21% less time on task²⁵ | 96 Google engineers, summer 2024 |
| METR randomized trial, early 2025 (2025) | 19% longer task time²⁶ | 16 experienced open-source developers, 246 issues |
| METR follow-up, late 2025 (2026) | Estimated 18% less time (returning developers) and 4% less (new developers)²⁷ | 57 developers, 800+ tasks; both confidence intervals cross zero |
Methodology note: each row keeps the source’s own unit; Microsoft’s authors caution that “a merged PR is not the same as the value it delivers.”22
Caveat: METR reports its late-2025 results as “a speedup of -18%” and “-4%” on the same time-on-task axis as its early-2025 “+19%,” and calls the data “an unreliable signal” because developers could opt out of the no-AI condition.27 Its early-2025 developers believed AI had sped them up by 20% while it slowed them by 19%.26
Output is one side. The table below shows quality and stability at high AI adoption, from Faros AI’s telemetry, in percent change from low-adoption periods inside the same organizations.
Change in Delivery Metrics at High AI Adoption Versus Low Adoption, Same Organizations (Faros AI, Q2 2026)
| Metric | Change |
|---|---|
| Tasks throughput | +33.7%²⁸ |
| Pull request size | +51%²⁸ |
| Bugs per pull request | +28.7%²⁸ |
| Incidents per pull request | +242.7%²⁸ |
| Deployments per week | -11.7%²⁸ |
Methodology note: two years of telemetry from 22,000 developers across 4,000 teams; Faros also reports epics completed up 66.2%, median review time up about five-fold, and code churn up about ten-fold.28
Caveat: Faros’s full reports are gated, so these are directional comparisons inside one vendor’s customer base.28 DORA’s 2024 modeling gave the same direction with smaller magnitudes, an estimated 1.5% decrease in throughput and 7.2% decrease in stability for every 25% increase in AI adoption, and its 2025 report found AI now improves throughput but “still increases delivery instability.”1,2 LinearB locates the bottleneck in review: agentic AI pull requests sat idle 1,055 minutes before a reviewer opened them, against 201 for unassisted ones.3
What This Means
Our analysis shows three things.
- First, output is up, within a range. The field studies converge on 21% to 39% more output, with METR’s slowdown the measured exception, on a small sample of experienced developers working in repositories they knew deeply.22,23,24,25,26 That exception matters: the more context a developer already carries, the less an assistant has to add.
- Second, the cost lands downstream: larger pull requests, longer waits for review, more incidents per pull request, and fewer deployments per week in Faros’s data, and lower stability in DORA’s.1,28 A team can write more code and ship less of it.
- Third, the hours saved are modest and self-reported: DX’s developers report 3.6 hours a week on average and 4.1 for daily users.29 Agents arrived faster than the measurement did: in mid-2025, 61% of DORA’s respondents had never used AI in an agentic mode, and by mid-2026, 90% of professional developers in JetBrains’ survey used coding agents at least weekly.2,30 That is real, but it is closer to half a day than to the doubling some vendor claims suggest.
- Fourth, agents arrived faster than the measurement. In mid-2025, 61% of DORA’s respondents had never used AI in an agentic mode. By mid-2026, 90% of professional developers in JetBrains’ survey used coding agents at least weekly. 2, 30 Most of the studies above measured assistants, not agents, so the benchmarks are already a step behind how teams work.
In Practice
The most common mistake we see is scaling agents before the controls exist. The Faros data above shows the cost: throughput rises, and so do incidents per pull request. Keyhole’s rule is short: “AI increases speed. It also increases the cost of weak governance.”
We bring agentic tools like Claude Code and Codex into architect-governed workflows with test-gated pipelines and defined architectural boundaries. On the insurance platform above, each repository carried a rules file the agent read first, schema changes needed security validation, and the team has reported zero security incidents. (We describe that workflow in more detail in AI Coding Tools in Enterprise Software Delivery: An Architect’s Workflow and Enterprise AI-Assisted Development: How Teams Get Repeatable Results.)
As a member of Anthropic’s Claude Partner Network, we compare notes with other delivery teams regularly, and one pattern holds: the teams getting the throughput gains without the incident spikes kept a human review gate and enforced it in the pipeline.9
What Developer Productivity Benchmarks Mean for 2026 Planning
The data supports three conclusions.
- Elite delivery still means on-demand deploys, lead times under a day, and recovery in under an hour on DORA’s scale, and a cycle time under 25 hours on LinearB’s.1,3
- Size and industry explain less than leaders expect: the elite cycle time threshold differs by 2 hours between start-ups and enterprises, and the spread inside an industry is 20-fold.3,11
- And AI has moved the constraint: output per developer is up 21% to 39% in the field studies, while review wait time, incidents per pull request, and recovery time are moving the wrong way.7,22,23,25,28
For technical leaders setting 2026 targets, work through these steps in order:
- Measure the full cycle from first commit to production, split into coding, pickup, review, and deploy.
- Benchmark against your own size band and your own history before the headline tier.
- Find the longest phase and fix that one first. In most of the data, it is the deploy phase.
- Put review and release gates under the same scrutiny as coding speed, with tests and approvals enforced in the pipeline.
- Scale AI agents only after those controls exist, and track incidents per pull request and review wait time next to throughput.
These steps work whether you do them in-house or with a partner. If you are setting productivity targets or evaluating how AI coding agents fit your delivery pipeline, Keyhole’s senior, U.S.-based consultants can help. You can reach us at keyholesoftware.com/contact
References
- DORA, Google Cloud, “Accelerate State of DevOps Report 2024”
- DORA, Google Cloud, “State of AI-assisted Software Development 2025”
- LinearB, “2026 Software Engineering Benchmarks Report”
- DX, “DX Core 4 Benchmarks,” accessed October 2026
- Keyhole Software, “Government Enterprise CI/CD Platform Modernization Case Study”
- DX, “The State of AI Impact in Engineering: Q2 Report,” July 2026
- CircleCI, “The 2026 State of Software Delivery,” February 17, 2026
- Keyhole Software, “AI-Accelerated Development in Practice”
- Keyhole Software, “Inside Anthropic’s Emerging Partner Ecosystem”
- Keyhole Software, “Services”
- CircleCI, “The 2025 State of Software Delivery,” March 2025
- U.S. Census Bureau, “BTOS AI Supplement Table 2026,” Question 10
- U.S. Census Bureau, BTOS AI supplement press release, June 4, 2026
- FRED, “Generative AI, Time Savings: Information (RPSGENAITSIND9)”
- FRED, “Generative AI, Time Savings: Finance and Insurance (RPSGENAITSIND10)”
- FRED, “Generative AI, Time Savings: Health Care and Social Assistance (RPSGENAITSIND16)”
- FRED, “Generative AI, Time Savings: Employed Adults (RPSGENAITSALL)”
- FRED, “Generative AI, Time Savings: Computer and Mathematical (RPSGENAITSOCC3)”
- Keyhole Software, “Government Cloud, .NET & React Modernization Case Study”
- Reock, J., DX, “AI-Assisted Engineering: Q1 Impact Report,” 2026
- Stack Overflow, “2026 Developer Survey: AI”
- Murphy-Hill, E., et al., Microsoft, “Adoption and Impact of Command-Line AI Coding Agents,” 2026
- Cursor, “The Productivity Impact of Coding Agents,” November 11, 2025
- Cui, Z., et al., “The Effects of Generative AI on High-Skilled Work,” SSRN, February 2025
- Paradis, E., et al., Google, “How Much Does AI Impact Development Speed?” arXiv:2410.12944, November 2024
- METR, “Measuring the Impact of Early-2025 AI on Experienced Open-Source Developer Productivity”
- METR, “We Are Changing Our Developer Productivity Experiment Design,” 2026
- Faros AI, “The AI Acceleration Whiplash,” AI Engineering Report Q2 2026
- Tacho, L., DX, “AI-Assisted Engineering: Q4 Impact Report,” November 2025
- JetBrains Research, “AI Coding Agents: Adoption Trends,” August 2026
More From Keyhole Software
About Keyhole Software
Expert team of software developer consultants solving complex software challenges for U.S. clients.
Share This Post
Join The Thousands Of Devs Who Subscribe
Discuss This Article
Subscribe
Login
0 Comments
Oldest