
When the Spreadsheet Is the System: Modernizing Excel-Run Business Processes
Three things are guaranteed in life: death, taxes, and a workbook somewhere in the company that everyone is afraid to sort.
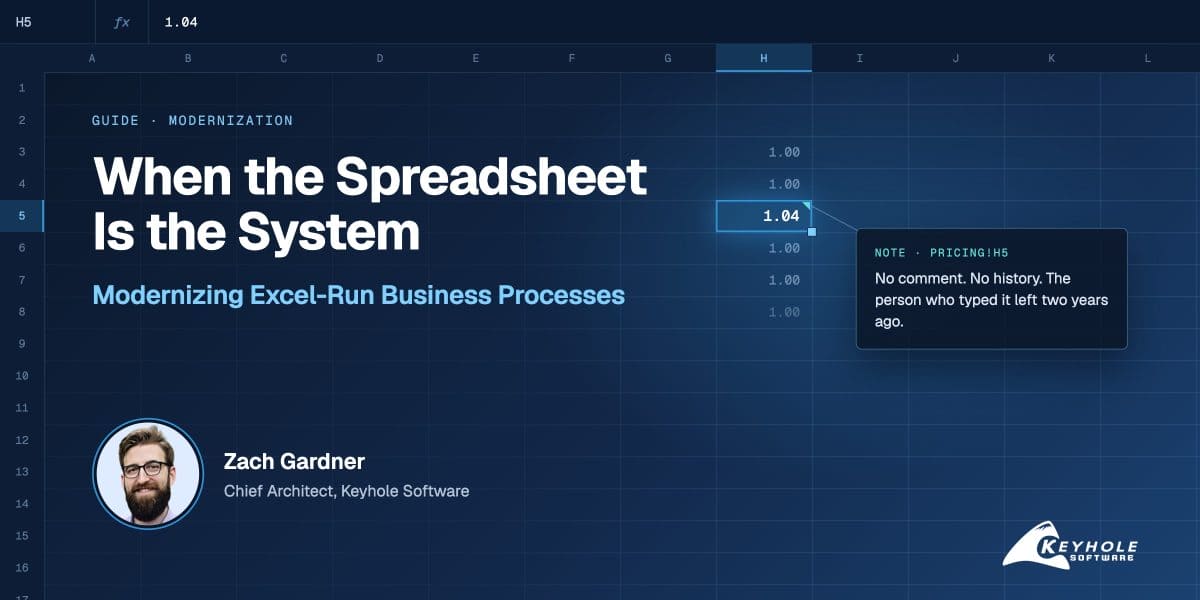
Picture a customer calling to ask why their renewal quote went up 4%. The sales rep opens the pricing workbook and traces the number back to a cell on a hidden tab that just says 1.04. There’s no comment and no history, and the person who typed it left the company two years ago. Nobody wants to change it, because nobody knows what else depends on it.
An Excel workbook like that is a business system, whether or not anyone calls it one, and the research on how often these systems are wrong isn’t encouraging:
- Field audits compiled at the University of Hawaii1 found errors in 88% of the operational spreadsheets examined.
- The best-known failures (JPMorgan’s London Whale, Public Health England’s missing COVID cases, TransAlta’s $24 million bid error) came from ordinary things like copy-and-paste, row limits and hidden rows.
Replacing a spreadsheet with a web application sounds like a standard modernization project. In practice it behaves very differently. There’s no codebase to analyze, no test suite and no engineering owner. The requirements live in formulas, cell layout, manual steps around the file and the heads of the people who use it, and those people will go right back to Excel the moment the new system is less flexible than the old one.
Spreadsheet modernization should be treated as its own kind of project, with most of the early effort going into discovery and redesign instead of code.
Download the Full PDF GuideBelow, I’ll walk through how often spreadsheets go wrong and why replacing one is a different problem from modernizing legacy code. We’ll discuss how to choose a replacement platform, where AI helps, and a step-by-step approach to the work.
Where the evidence is thin, or the cause of a famous failure is more complicated than the headline, I’ve tried to say so.
How Often Spreadsheets Are Wrong
Raymond Panko has studied spreadsheet errors for decades, and his compilation of field audits is still the most-cited source. Across the field audits done from 1995 to 2007, 88% of the 113 operational spreadsheets examined contained errors1, 2. The smaller sets of intensive audits Panko compiled in 2005 and 2015 put the figure at 94%1, 3. In the audits that measured it, the share of formula cells with an error (the cell error rate) ranged from 0.4% to 6.9%1.
| Measure | Figure | Source |
|---|---|---|
| Audited operational spreadsheets with errors (field audits, 1995 to 2007) | 88% of 113 | Panko, What We Know About Spreadsheet Errors1 |
| The same measure in Panko’s intensive-audit compilations | 94% | Panko (2005, 88 spreadsheets; 2015, 85 spreadsheets)1, 3 |
| Cell error rate in field audits | 0.4% to 6.9% | Panko1 |
| Average cell error rate across 14 lab studies | 3.9% | Panko, What We Don’t Know About Spreadsheet Errors Today3 |
| Genomics papers with Excel-corrupted gene names | 30.9% (3,436 of 11,117) | Abeysooriya et al., PLOS Computational Biology (2021)4 |
To put the cell error rate in practical terms, a workbook with 10,000 formula cells at the low end of that range (0.4%) would still carry about 40 wrong cells. Most of them won’t matter. The ones that do are the ones sitting on a decision path, feeding a price, a forecast or a regulatory number.
The errors also tend to be the kind their authors can’t see. In one experiment by Panko and Halverson1, 45% of the errors were logic errors, 23% were mechanical slips such as pointing at the wrong cell, and 31% were omissions.
Logic errors and omissions are hard to catch in review because the formula looks reasonable (it’s the spreadsheet version of code that compiles fine and does the wrong thing). Panko’s broader argument, drawn from human-error research1, is that people make small mistakes in roughly 1% to 5% of the steps in a complex task, no matter how careful they are. Code has compilers, tests and code review to catch those slips. A spreadsheet keeps every one of them and passes it along through every cell that references it.
Two experienced UK auditors Panko interviewed1 said they had never seen a major spreadsheet that was free of errors. I’d believe them.
What It Looks Like When They Fail
The public record of spreadsheet failures is long5, 6, and the striking thing about it is how ordinary the causes are. Nobody in these cases did anything exotic.
| Case | Year | What Went Wrong | What It Cost |
|---|---|---|---|
| Fidelity Magellan | 1994 | A tax accountant dropped the minus sign on a $1.3 billion net capital loss while copying it into another spreadsheet | The dividend estimate was off by $2.6 billion, and a promised year-end distribution was canceled. This was an estimating error, not a realized loss |
| TransAlta7, 8 | 2003 | A cut-and-paste error in a bid spreadsheet for New York transmission contracts | A US$24 million pre-tax loss. The CEO called it “literally a cut-and-paste error in an Excel spreadsheet” |
| Barclays and Lehman Brothers9 | 2008 | Rows in a spreadsheet of Lehman contracts had been hidden instead of deleted, and they reappeared when the file was converted to PDF for the bankruptcy court | 179 contracts Barclays didn’t want ended up in its purchase offer, and a court motion was needed to remove them |
| JPMorgan “London Whale”10, 11 | 2012 | A new value-at-risk model ran through Excel spreadsheets that were filled in by copying and pasting, and one step divided by a sum instead of an average | Reported risk was understated while the trading losses grew to about $6.2 billion |
| Reinhart and Rogoff12 | 2010, found in 2013 | An AVERAGE formula covered rows 30 to 44 instead of 30 to 49, leaving out five countries | Together with data exclusions and weighting choices, it changed the paper’s headline growth figure for high-debt countries from −0.1% to +2.2%. The formula error alone accounted for 0.3 percentage points |
| Public Health England13 | 2020 | Lab results were loaded into the old .xls format, which stops at 65,536 rows | 15,841 positive COVID cases went unreported for about a week, and by one estimate as many as 48,000 contacts weren’t traced in time |
| Genomics research4 | 2016 to 2021 | Excel’s default settings turn gene symbols such as SEPT2 and MARCH1 into dates | Corrupted gene lists appeared in 30.9% of the papers checked in 2021, and the official naming committee renamed the genes to work around Excel |
| UK Ministry of Defence14 | 2022 | An official who meant to share details on about 150 people sent a spreadsheet with hidden data that wasn’t evident to the sender | Personal details of roughly 18,700 Afghan applicants for relocation were exposed |
| Norway’s sovereign wealth fund15 | 2021 to 2023 | A staff member used December 1 instead of November 1 when rebalancing the fund’s bond benchmark | About NKr980 million (roughly $92 million) lost, according to FT Alphaville. The fund’s own disclosure doesn’t say which tool was involved |
To be fair to Excel, I’d be careful with how these get retold. In the JPMorgan case, the bank’s own task force blamed the losses on the trading strategy10. The spreadsheet error turned off a warning light instead of causing the crash. Most of the Reinhart and Rogoff reversal came from the exclusion and weighting choices, not the formula. Fidelity’s $2.6 billion was a forecasting mistake that was caught before any money moved. Overstating these cases (“Excel lost JPMorgan $6 billion”) is an easy way to lose credibility with a CFO who knows the details.
The other side of that caution is that these are only the failures that became public. Companies rarely disclose internal spreadsheet losses, so the published record almost certainly understates the problem.
The Risks Beyond Wrong Numbers
Error rates get the headlines, but most of the day-to-day risk of running a process in Excel comes from how the file is owned, shared and connected to everything else.
Operational Risk
The biggest one is usually a single person. JPMorgan’s VaR model was built by someone who “had not previously developed or implemented a VaR model”10 and didn’t get the support he asked for. In a mid-sized company, the critical workbook typically belongs to one person in operations or finance, and when that person leaves, the logic leaves with them.
Version sprawl comes next. Once a file named final_v3_FINAL.xlsx has been emailed around, nobody can say for sure which copy is authoritative. Co-authoring in Microsoft 365 helps, but plenty of critical workbooks are still legacy .xls or .xlsm files on a shared drive, edited offline and saved over each other.
Excel also doesn’t keep a real audit trail. For a file on a shared drive, it doesn’t record who changed an input, when, or why. Workbooks co-authored in OneDrive or SharePoint get version history and a Show Changes pane that shows who edited which cells, but nothing records why a number changed. Free-form cells accept anything, so type coercion (gene names, dropped leading zeros, dates), merged cells and mixed units are normal. External links between workbooks break when a file is moved or renamed, sometimes silently, returning stale values. Logic written in VBA is code in every sense, except that it has no tests, no source control and often an author who left years ago. When security policy disables macros, those workbooks stop working.
There are hard limits too. A modern .xlsx sheet stops at 1,048,576 rows and 16,384 columns16, and the legacy .xls format stops at 65,536 rows, which is what bit Public Health England. Performance falls off well before those limits, and 32-bit Excel runs into a 2 GB memory ceiling.
Compliance and Security
Any spreadsheet that feeds financial reporting is in scope for SOX Section 404. Auditors expect an inventory of key spreadsheets, a risk ranking, and controls over access, changes, versions and review. Even so, in a survey of US public companies published through the European Spreadsheet Risks Interest Group (EuSpRIG), 21 of 24 respondents (88%)17 said they had no computing policy specific to spreadsheets, years after SOX took effect.
Regulated firms usually manage this through an end-user computing (EUC) policy, which identifies and inventories these tools, rates them by materiality and complexity, and puts controls around the important ones. In one EuSpRIG case study, 90% of the applications covered by the EUC policy were spreadsheets18. There’s a whole market of tools (Mitratech ClusterSeven and Apparity are two examples) built to put controls around spreadsheets because replacing them is so hard.
Privacy is the other exposure. Spreadsheets get emailed, copied to personal drives and shared with hidden content still inside, and the Ministry of Defence and Barclays cases both show that hidden doesn’t mean deleted. Workbook and sheet protection is easy to bypass, and there’s no row-level or field-level security. Applying role-based access, data minimization and retention rules under HIPAA, GLBA or state privacy laws to a folder of workbooks is close to impossible.
Manual Integration and Shadow IT
Spreadsheets connect to other systems through people. Someone exports from the ERP, pastes into the workbook, reconciles and emails the result. That manual layer is exactly where the TransAlta and JPMorgan errors happened. In a 2024 Intuit QuickBooks survey19 of 630 owners and executives at US companies with 10 to 99 employees, respondents reported spending 25 hours a week on manual data entry or reconciliation across apps, and 85% said it hurt profitability.
Those hours add up fast, and we’ve seen it up close. A manufacturing client was running production and order tracking on spreadsheets and paper, and just one of its recurring spreadsheet tasks took about five person-hours of copying, checking and re-entering data every time it came around. Our team automated it with Apache POI, and that same job now runs in a single click. That’s time handed straight back to the people who know the business best, and one less place for a copy-and-paste error to slip in.
At the organizational level, Gartner found that 41% of employees20 acquired, modified or created technology outside IT’s visibility in 2022, and predicted that figure will reach 75% by 2027. Spreadsheets were the original form of that shadow IT, and they’re still the most common one.
The pressure behind this is growing. Gartner forecast that low-code development spending would reach $44.5 billion by 202621, with developers outside formal IT making up at least 80% of low-code users, and AI coding tools are making it even easier for people outside IT to build their own tools. In Retool’s 2026 survey22 of its own customers and builders, 60% said they’d built something outside IT oversight in the past year. That’s mostly a good thing, but every one of those tools is a future candidate for the same inventory and risk rating.
We recently saw how quickly that risk can catch up with a tool. A founder without a software background had spent close to a year building a stock alerting platform, mostly with AI coding tools and no technical review. It had a working interface, but large parts of the source code had never made it into the repository, and the app was running from cached files on the server. When those files were deleted, it couldn’t be redeployed. With no reliable source of truth, we worked backward from the incomplete code and leftover artifacts to figure out how the alerts were supposed to work, then rebuilt the engine in Python. Core functionality was back within two weeks, alert processing went from constant timeouts to under a minute, and the founder launched the product.
It’s the same lesson as the spreadsheet with the mystery 1.04: when the logic only lives in one fragile place, the business is one deleted file away from losing it.
Why This Isn’t Like Modernizing Legacy Code
In a COBOL or monolith modernization, the code is the specification. It may be ugly, but you can parse it, generate call graphs, find dead code and run characterization tests against it. A spreadsheet doesn’t give you that, and the easiest way to see why is to follow one business rule through a workbook.
Say a distributor prices orders in a workbook. Every Monday, someone pastes the ERP’s order export into a tab called Raw, and a VLOOKUP pulls list prices from another tab. Key accounts are the rows highlighted in yellow. For those rows, the person running the file types 12% over the calculated discount, unless the account manager has emailed asking for something different. Then the file is saved under a new name and sent to the warehouse.
Written out, the rule is “key accounts get 12% off unless their account manager says otherwise.” It’s implemented through a fill color, a number typed over a calculation and an email. Static analysis of that workbook would find a VLOOKUP and a hard-coded 12% in a few cells, which tells you almost nothing about how pricing works. You’d only learn the rule by watching someone run the file on a Monday, or by asking them why some cells don’t match the formula next to them (and hoping they remember).
Real workbooks have dozens of rules like that, spread across formulas addressed by position instead of by name, conditional formatting, hidden rows and sheets, named ranges, VBA, and whatever the author knows about which customers are exceptions this quarter.
Academic work treats spreadsheets as programs written by end users that need to be reverse engineered. Felienne Hermans and her colleagues at TU Delft23 built tools that extract class diagrams and leveled dataflow diagrams from spreadsheets. In their study at a large financial company, 85% of the analysts surveyed regularly handed spreadsheets to colleagues, and 70% had trouble understanding the ones they received. Handover was the scenario they found hardest, and a modernization project is one big handover.
The Owners Are Business Users
The author of a critical workbook is usually a respected domain expert who built the thing the business runs on. Replacing it can feel like a demotion, so expect some defensiveness. Giving that person real ownership of the replacement, which the approach section covers, goes a long way.
The other thing they lose is autonomy. In Excel, a user can change a calculation in 30 seconds. In a web application, the same change goes through a ticket, a sprint and a deployment. That gap is the main reason people drift back to spreadsheets, and it comes up again in the redesign step below.
Users will also judge the new system against Excel’s grid: editing in place, copy and paste, fill-down, keyboard speed and quick pivots. diginomica’s write-up on shadow IT24 makes the point that the universal question on BI and data warehouse projects was “Where is the ‘export to Excel’ button?”
The Data Has No Schema
Spreadsheet data has an implicit schema at best. Expect several entities on one sheet (orders and customer details on the same row), repeated header blocks, subtotals mixed in with data rows, merged cells, notes typed into numeric columns (“TBD,” “see email”), mixed date formats and numbers stored as text. Some type-coercion damage will already have happened, with IDs turned into dates and leading zeros gone. Copies of “the same” file will have drifted apart. There’s also no history to migrate, because the spreadsheet overwrote it.
In the pricing example, “key account” exists only as a fill color, so the new system needs a real field for it, and somebody has to decide which yellow rows were deliberate. Budget real time for profiling and normalization, plus the data-quality decisions only the business can make, like which of three spellings of a customer’s name is the right one.
The Spreadsheets Come Back
Shadow systems after an ERP go-live are a well-documented pattern25 in information systems research. In BPM Partners’ 2024 survey26, 87% of respondents said they still use spreadsheets alongside their new planning system. Practitioner write-ups describe the same story again and again: a spreadsheet survives the ERP because the logic in it never made it into the requirements. I’d treat every spreadsheet that shows up after go-live as an unmet requirement, not a compliance violation.
Exploratory analysis is the other reason they come back. Operational workflows move into web applications well, but ad hoc analysis usually doesn’t. If the new system can’t export clean, current data to Excel or connect to it, users will rebuild the old workbook on top of manual exports and recreate the risk you just removed. Governed export, Excel or Power BI connectivity, or an analysis-friendly read model should be a requirement from the start.
Proving Parity with a Spreadsheet That’s Probably Wrong
If most audited spreadsheets contain errors, the one you’re replacing probably does too, and that changes what parity means. A mismatch between the old and new systems might be a defect in the new code, a defect in the spreadsheet or a deliberate change, and someone on the business side has to decide which. Sometimes the answer means restating numbers that customers or auditors have already seen.
The testing mechanics, which borrow Michael Feathers’ idea of characterization tests and apply it to a workbook, are in the approach section below. Each spreadsheet defect found along the way should go into the findings with its financial impact, since that’s often the clearest evidence of what the old process was costing.
Sizing the Work
Lines of code, function points and COCOMO-style models don’t apply here. The size of the work depends on the number of distinct calculations and decision rules, the manual steps in the workflow, the file feeds coming in and going out, the state of the data, and how many stakeholders are involved.
Workbook size is a poor guide on its own, since one workbook with a few dozen tabs can turn out to hold as much logic as a mid-sized application. Discovery has to map these drivers before a build estimate means much.
Legacy Code vs. Spreadsheets, Side by Side
| Factor | Legacy Code (COBOL, Monolith, Older .NET or Java) | Spreadsheet-Based Process |
|---|---|---|
| Where the logic lives | Code that can be parsed and versioned | Formulas, layout, formatting, VBA, manual steps and tacit knowledge |
| Who owns it | Engineers and IT | Business users |
| How you discover it | Static analysis, call graphs, dependency mapping | Workbook forensics, dataflow extraction, watching the process, interviews |
| Existing tests | Sometimes, plus logs and production traffic | Almost never, with few logs and overwritten history |
| Data | A structured schema, possibly ugly | An implicit schema, merged cells, coerced types, duplicates across copies |
| Strangler fig migration | Route traffic through a façade one capability at a time | No request stream to route, so cut over one workflow or tab at a time while the workbook reads from the new system |
| Characterization tests | Run against the legacy runtime | Run against the workbook with historical cases, expecting to find spreadsheet bugs |
| Change expectations | Release cycles are already accepted | Users are used to instant changes |
| Integration | APIs or batch jobs already exist | People copying and pasting |
| Most likely failure | The rewrite stalls, or behavior doesn’t match | Users don’t adopt it, and the spreadsheets come back |
| Value from a straight port | Moderate, since platform risk goes away | Low, since the value comes from redesign, controls and integration |
Several familiar techniques still carry over: incremental delivery in the spirit of the strangler fig, characterization and golden-master testing, domain-driven design and event storming with the domain experts, parallel running, and feature toggles.
Automated code translation, sizing based on static analysis, cutover through a routing layer and reliance on an existing test suite mostly don’t.
Choosing the Right Replacement Platform
A custom web application is one option, and often not the first one I’d reach for. Before picking a platform, I’d ask a few questions.
- Does the spreadsheet run a process every company has, like AP or inventory, or something specific to how this business competes?
- Does anyone outside the company need to use it?
- How often does the logic change, and who changes it today?
- Is it in scope for SOX or another regulation?
There’s no silver bullet here, and if anyone tells you one platform fits every spreadsheet, they’re selling you something. The answers usually point to one of five options.
| Option | Examples | Best Fit | Watch Out For |
|---|---|---|---|
| Off-the-shelf SaaS or an ERP module | NetSuite, QuickBooks plus apps, vertical SaaS, FP&A and EPM tools | The spreadsheet runs a commodity process such as AP, inventory, CRM or budgeting | Configuration gaps spawn new shadow spreadsheets, and most finance teams keep Excel after buying a planning platform26, 27 |
| Spreadsheet-like low-code databases | Airtable, Smartsheet, Microsoft Lists | Team-level tracking and light workflow where users want to keep a familiar grid | Limits on governance, scale and complex calculations, and the risk of becoming the next generation of shadow IT |
| Low-code app platforms | Power Apps with Dataverse or SQL, Retool | Internal tools on a real database, especially for Microsoft-centric companies with IT-sanctioned citizen development | Licensing cost at scale, vendor lock-in, and the same need for data modeling and testing |
| Excel-connected hybrid | Excel as the front end to a governed database or FP&A platform, Power Query to SQL | Finance and analysis-heavy users who won’t give up the grid, or as a transition step | Logic can stay in Excel, so controls have to be enforced in the back end |
| Custom web application | React, .NET, Java or Python on a relational database | Complex, regulated or differentiating processes, heavy integration, access for customers or partners, or logic that’s a competitive asset | The highest cost, and it needs real product ownership, a change process and a path for export and analysis |
The rough rule I’d use: a commodity process goes to SaaS, team-level tracking goes to a low-code grid, and an internal tool with modest logic on clean data goes to a low-code app platform. Processes that are proprietary, complex, regulated, shared with outside parties or heavily integrated are where custom development earns its cost. Most real projects end up as a mix, with a custom core, SaaS for the commodity pieces, and Excel kept for analysis on top of governed data.
Sometimes the right answer doesn’t involve building an application at all. When an industrial automation company came to us with engineering work tracked in spreadsheets, we set them up on Jira, Confluence and Bitbucket instead of a custom build. Within 90 days, ticket throughput rose 25%, Confluence documentation contributions tripled, and context-switching dropped 40%.
Whatever the target, a pixel-for-pixel copy of the workbook carries over every workaround built around Excel’s limits, like approval by email, re-keying, and reconciliation tabs that exist only because two files disagree. The better approach is to map the process end to end, drop the steps that only existed to compensate for the spreadsheet, and rebuild around a proper data model and workflow. Keep what the spreadsheet did well, which is usually transparent calculations, parameters users can tune themselves, and fast data entry.
Sometimes the spreadsheet isn’t yours to replace. We worked with a group of restaurant franchise owners whose monthly operational metrics arrived as an Excel file from the franchisor’s home office. They couldn’t change that file, so we built around it: a Spring Batch application that reads each month’s workbook, runs the calculations, stores the results in PostgreSQL and generates store-performance reports. Replacing the spreadsheet was never an option, but replacing the manual work around it was. The file still arrives every month, but the numbers no longer have to be re-keyed by hand, and every month’s results are kept in one place instead of being typed over.
Where AI Helps and Where It Doesn’t
I’m cautiously optimistic about AI for this kind of work, mostly on the discovery side. Microsoft Research’s SpreadsheetLLM paper (2024)28 introduced an encoding method called SheetCompressor that cut the tokens needed to represent a spreadsheet by 96% and improved GPT-4’s table detection by 25.6%, which makes it practical to hand a model a large workbook and ask it to summarize the structure, explain dependencies or extract rules.
Models can now act inside Excel too. Microsoft launched Agent Mode in Excel in September 202529 and reported 57.2% accuracy on SpreadsheetBench, a benchmark of 912 tasks drawn from real forum questions. For comparison, the SpreadsheetBench authors measured humans at 71.3% on a 50-task subset, and SiliconANGLE reported30 that the original Copilot in Excel scored about 20%. Microsoft ran its own tests, its Excel team notes that the benchmark doesn’t capture things like PivotTables, charts and dynamic arrays, and its FAQ tells users to verify anything Copilot creates31 and to avoid using it for decisions in sensitive areas such as finance.
In a modernization project, I’d use AI for:
- building the workbook inventory and scoring complexity
- writing plain-English narratives of what each formula and tab does, to seed the requirements
- drafting data-cleansing rules and migration scripts
- proposing candidate golden test cases from historical data
- spotting likely errors, such as a formula that’s inconsistent with the rest of its range or a hard-coded override
- generating code for the target application
The limit is that AI can tell you what a formula does, not whether it’s right or why the business wanted it that way. With accuracy still well short of an expert, every rule an AI extracts needs a person to confirm it and a characterization test to back it up.
Data handling is the other constraint. Many companies’ policies restrict uploading sensitive workbooks to AI tools, and Gartner reported in November 202532 that 69% of organizations suspect or have evidence that employees are using prohibited public generative AI tools. If you’re going to use AI on client or internal workbooks, use a sanctioned tool under an agreed data-handling policy, and don’t let the project become another source of shadow AI.
A Practical Approach to Spreadsheet Modernization
The order below matters more than the details. The early steps are cheap compared to the build, and each one can tell you to stop, change direction, or not build anything at all.
Start with an Assessment
Inventory the workbooks that matter: who owns each one, what it’s for, who uses it, which files feed it and which it feeds, how often it runs, and whether it has macros or external links. Rate each one by materiality, complexity and how weak its current controls are, borrowing the conventions SOX and EUC programs already use. Automated scans and AI-written formula narratives make this go faster.
The hard part is deciding what counts as critical. Every owner thinks their workbook is, and the inventory tends to balloon. I’d anchor the ranking on money, regulatory exposure and customer impact, and accept that most workbooks will end up with a disposition of “leave it alone” or “put basic controls around it.” The assessment is also the first place a project can end early, and that’s a perfectly good outcome. If a workbook turns out to run a commodity process, the answer is usually a SaaS product instead of a custom build.
Run Discovery Like an Investigation
The most common mistake here is interviewing only the workbook’s author. The author can explain how the file is supposed to work, but the people downstream often depend on quirks the author doesn’t know about, and whoever runs the file each Monday is usually the only one who knows which cells get typed over. Watch the process during a real cycle, ideally one that includes a quarter-end or some other rare event, because the rules that only fire four times a year are the ones that get missed. The output is a catalog of business rules, each with a note on where it came from.
If discovery turns up rules that nobody can explain or defend, pause there. Those rules need a decision from the business owner before anyone builds them.
Redesign Before Building
Honestly, this is the step I’d least want to skip. Process-mapping or event-storming workshops with the spreadsheet’s owner are where the steps that only existed to work around Excel get removed and the data model takes shape. The main design decision is which business rules users should be able to change themselves. I’d make the values that change often (rates, thresholds, mappings) configurable by authorized users, and keep the structure of each calculation in application code where it can be tested. Getting this wrong in one direction creates a deployment bottleneck for routine changes, which pushes people back to Excel. Getting it wrong in the other direction reproduces the spreadsheet’s lack of controls in a new interface.
Migrate by Workflow
A big-bang cutover of a business-critical workbook is the riskiest way to do this. Move data capture into the new system first, and let the old workbook read from it so the analysis people depend on keeps working. Then move the calculations, and retire tabs as each piece is proven. The in-between period, when some data lives in the new system and some still lives in the workbook, is where this goes wrong. Keep that window short, and be explicit about which system is the source of truth for each piece of data.
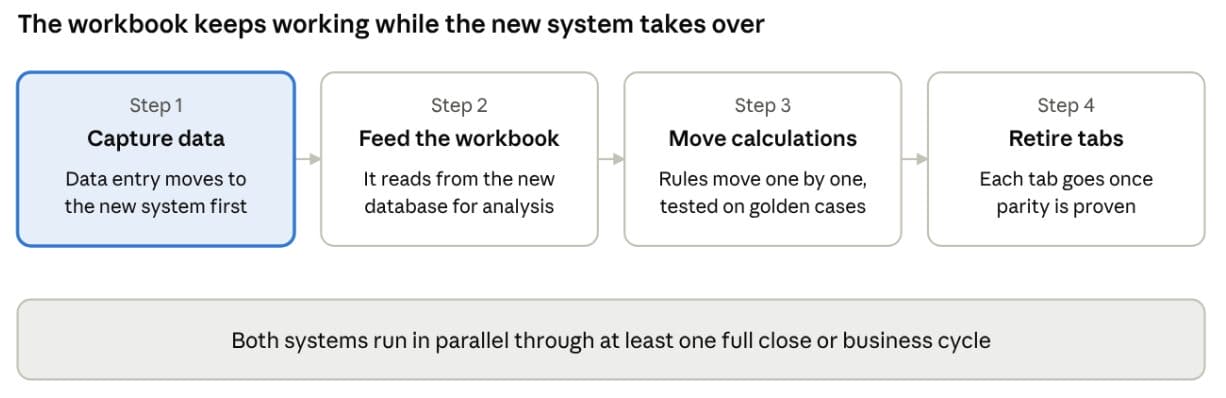
Migrating by workflow: four steps with a parallel run
This is how we approached a manufacturing client’s move off spreadsheets and pen-and-paper production tracking. Rather than forcing everyone off Excel on day one, the first release converted the existing Excel worksheets into structured JSON that a new Electron desktop app read for line supervisors, which also kept working when the plant network was unreliable. Order tracking, production scheduling and shipping then moved to a React and Java/Spring Boot application one workflow at a time, with Cucumber tests covering the business rules as each piece came over.
Make Parity Testing Part of the Contract
Build the golden-case suite from real historical periods, agree on tolerance rules for floating-point and rounding differences, and classify every mismatch as a defect in the new system, a defect in the spreadsheet or an intentional change. Decide before the parallel run who signs off on spreadsheet corrections and who needs to hear about restated numbers. Then run both systems in parallel through at least one full close or business cycle. If the mismatches aren’t shrinking by the end of it, run another cycle before cutting over.
Design with Excel in Mind
Ship governed export and Excel or Power BI connectivity in the first release, along with grid-style bulk editing where users need speed and screens where authorized users can change parameters. Export is usually the first thing cut when a schedule slips, so protect it in the plan. Counting the side spreadsheets 90 days after go-live will tell you whether the design worked.
We’ve seen this play out firsthand. When we helped a vehicle title and registration logistics company move away from manual ordering steps, the new cloud application was only half the job. We also built the data pipelines and Tableau dashboards that turned that operational data into reporting the business could actually use. When people can get the numbers they need from the new system, they have a lot less reason to keep a workbook going on the side.
Plan for the People
The workbook’s author should be the product owner, with real authority over the backlog. If that person disengages partway through, treat it as a project risk. Be specific about what users gain (no more Monday reconciliations, numbers that hold up in an audit), hold office hours for the first 90 days, and log every new side spreadsheet as a backlog item.
Plan for Life After Go-Live
A process that lived in a spreadsheet will keep changing as fast as the business does, and the new system has to keep up.
Before go-live, decide who owns it afterward: who can change parameters, who approves a change to a calculation, and how fast a routine rule change can ship.
If the honest answer is “next sprint,” expect the side spreadsheets to be back by the next quarter-end. Log every parameter change with who made it and why, so the next 1.04 comes with a history instead of a mystery. That’s also why we like to structure this work as a fixed-price assessment, a build priced in phases after discovery, and ongoing support afterward.
Which Spreadsheets Are Worth Replacing
Excel isn’t going anywhere, and for a lot of analysis work I wouldn’t want it to (I’ll admit to a soft spot for a well-built pivot table). AFP’s 2025 benchmarking33 found that 96% of FP&A professionals still use spreadsheets for planning at least weekly. The workbooks worth replacing are the ones running a process that now carries real financial, regulatory or customer risk.
If I had to reduce this paper to one rule, it would be this: don’t accept a build estimate for replacing a business-critical spreadsheet until someone has watched it run through a full cycle and written down every rule they found. Most of the surprises in these projects come from logic that lives outside the formulas, like the yellow rows and the Monday email, and an estimate written before anyone has gone looking for it is a guess.
At Keyhole, we help clients work out which spreadsheets need a real system and build those systems alongside the people who know the process best, without turning the business into a guinea pig for a big-bang cutover. If you’re staring at one of these workbooks right now, I hope this gives you a place to start.
Download the Full PDF Guide
How We Researched This
We reviewed academic research on spreadsheet errors, published accounts of spreadsheet failures (official reports and contemporary news coverage where we could find them), industry surveys, analyst forecasts and vendor documentation, current as of late October 2026. A few limits apply.
- Most of the error-rate studies are dated and small. The field audits mostly predate 2010, cover 85 to 113 spreadsheets, and often looked at large or complex models, so the rates for simple trackers may be lower. Audits also miss errors, which suggests the true rates may be higher. Powell, Baker and Lawson (2008)34 argued that the audit data isn’t strong enough to support a precise estimate, so I’d read the percentages as evidence that errors are common, not as an exact rate.
- The cause of a famous failure is often only partly the spreadsheet. JPMorgan’s losses came from its trading strategy, the Reinhart and Rogoff reversal depended more on weighting and exclusion choices than on the formula error, and Fidelity’s $2.6 billion was an estimating error.
- Most of the market statistics come from vendors (Intuit, Retool and BPM Partners) with non-random samples, so treat them as directional.
- The AI benchmark figures are self-reported by Microsoft and cover only part of real spreadsheet work. Test any AI tool on workbooks like your own before building it into an estimate.
References
- What We Know About Spreadsheet Errors, Raymond Panko, revised 2005, 2008
- How to debug Excel spreadsheets, Journal of Accountancy, November 2015
- What We Don’t Know About Spreadsheet Errors Today, Raymond Panko, EuSpRIG 2015
- Gene name errors: Lessons not learned, Abeysooriya, Soria, Kasu and Ziemann, PLOS Computational Biology, 2021
- EuSpRIG horror stories, European Spreadsheet Risks Interest Group
- Anatomy of a Spreadsheet Failure: Analysing the EuSpRIG Horror Story Corpus, Thorne and Collins, arXiv, September 2026
- TransAlta Form 6-K, June 3, 2003, US Securities and Exchange Commission
- Excel snafu costs firm $24m, The Register, June 2003
- Excel error by a Cleary Gottlieb associate alters Lehman asset deal, ABA Journal
- Report of JPMorgan Chase & Co. Management Task Force Regarding 2012 CIO Losses, January 2013
- JPMorgan Chase Whale Trades: A Case History of Derivatives Risks and Abuses, US Senate Permanent Subcommittee on Investigations, March 2013
- Does High Public Debt Consistently Stifle Economic Growth? A Critique of Reinhart and Rogoff, Herndon, Ash and Pollin, PERI, April 2013
- PHE statement on delayed reporting of COVID-19 cases, Public Health England, October 2020
- The Afghanistan Response Route, National Audit Office, September 2025
- Norges Bank letter on the bond benchmark index, February 2023
- Excel specifications and limits, Microsoft Support
- Controls over Spreadsheets for Financial Reporting in Practice, Coster, Leon, Kalbers and Abraham, EuSpRIG
- Defining and Adopting an End User Computing Policy: A Case Study, Roger Turner, EuSpRIG
- Business Solutions Survey 2024, Intuit QuickBooks
- Gartner Unveils Top 8 Cybersecurity Predictions for 2023-2024, Gartner, March 2023
- Gartner Forecasts Worldwide Low-Code Development Technologies Market to Grow 20% in 2023, Gartner, December 2022
- The Build vs. Buy Shift: AI, Shadow IT, and the SaaS Replacement Era, Retool, February 2026
- Supporting professional spreadsheet users by generating leveled dataflow diagrams, Hermans, Pinzger and van Deursen, ICSE 2011
- Shadow IT never dies: why spreadsheets are still running your business, Neil Raden, diginomica, March 2023
- Why Do Shadow Systems Exist after an ERP Implementation?, Behrens and Sedera, PACIS 2004
- 2024 BPM Partners report, via Vena Solutions
- FP&A Trends Survey 2025, FP&A Trends Group
- SpreadsheetLLM: Encoding Spreadsheets for Large Language Models, Microsoft Research, 2024
- Vibe working: Introducing Agent Mode and Office Agent in Microsoft 365 Copilot, Microsoft, September 2025
- Microsoft wants everyone to start vibe working with AI agents in Excel and Word, SiliconANGLE, September 2025
- Frequently asked questions about Agent Mode in Excel, Microsoft Support
- Gartner identifies critical GenAI blind spots that CIOs must urgently address, Gartner, November 2025
- AFP FP&A Benchmarking Survey Report: Technology, Association for Financial Professionals, 2025
- A Critical Review of the Literature on Spreadsheet Errors, Powell, Baker and Lawson, Decision Support Systems, 2008
More From Zach Gardner
About Keyhole Software
Expert team of software developer consultants solving complex software challenges for U.S. clients.
Share This Post
Join The Thousands Of Devs Who Subscribe
Discuss This Article
Subscribe
Login
0 Comments
Oldest