
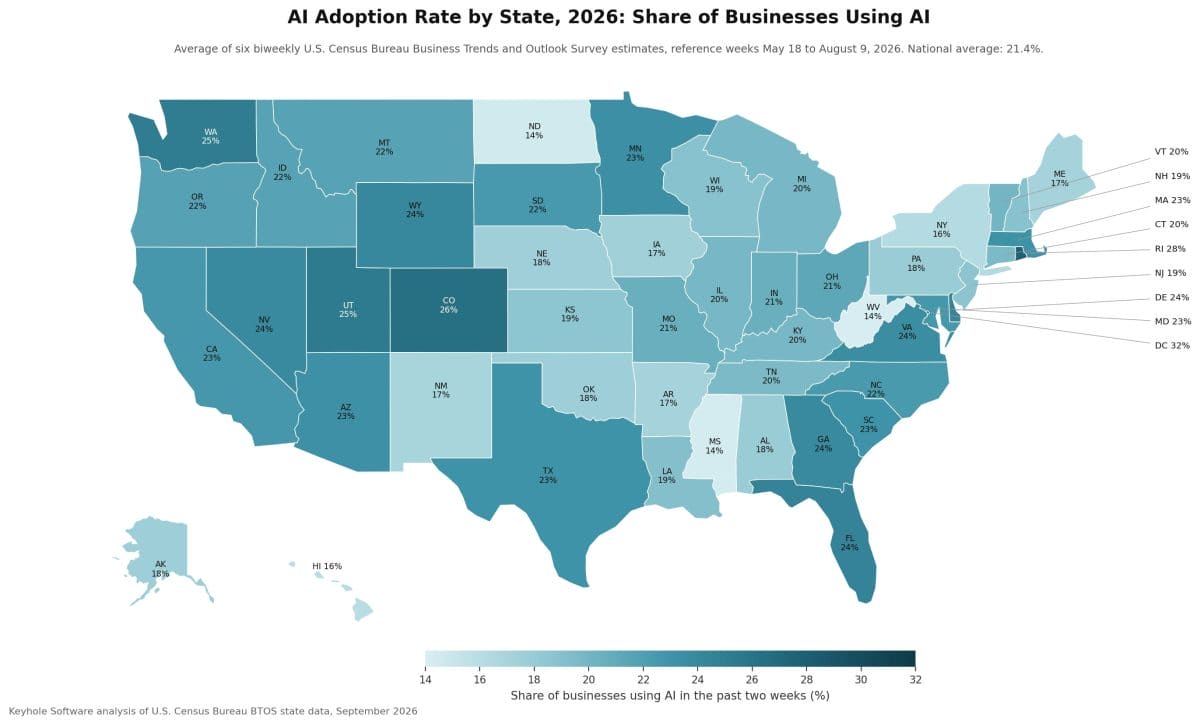
AI Adoption Rate by State (2026)
Industry, not geography, is what actually separates a 32% adoption rate from a 14% one. Twenty-nine of the 51 states and D.C. sit within a few points of the national average, consumers are already using AI ahead of the businesses that employ them in every single state, and the states leading the ranking today are growing just as fast as the states behind them, so the gap between them isn’t closing.
What follows ranks all 50 states and D.C. on business and consumer AI use, breaks adoption down by industry and metro area, and maps the talent, policy, and public investment behind it.
In the third quarter of 2026, the Keyhole research team analyzed 20 biweekly rounds of the U.S. Census Bureau’s Business Trends and Outlook Survey, collected from November 2025 through August 2026, to rank AI adoption by state. That survey data was combined with state-level figures from Microsoft, Anthropic, the Stanford AI Index, four Federal Reserve banks, CBRE, and state budget records.
The resulting dataset covers business AI use across all 50 states and the District of Columbia, consumer AI use in every state, AI use by industry and in the 25 largest metro areas, and state-level AI readiness and public investment figures. Where a figure is Keyhole arithmetic on published estimates rather than a reported number, the table notes say so.
AI Adoption Rate by State, Ranked (2026)
The District of Columbia leads the country with 32.0% of businesses using AI, followed by Rhode Island at 27.8%, Colorado at 26.4%, Utah at 25.4%, and Washington at 25.1%.1
The table below ranks every state on the same Census question: whether the business used AI in any of its business functions in the past two weeks. Because each biweekly state estimate carries a sampling error of several points, the ranking uses the average of the six most recent survey rounds, with the latest single round shown beside it.
Business AI Adoption Rate by State, Ranked
| Rank | State | Businesses Using AI, May to Aug. 2026 Average | Latest Round, Jul. 27 to Aug. 9, 2026 |
|---|---|---|---|
| 1 | District of Columbia | 32.0% | 33.7% |
| 2 | Rhode Island | 27.8% | Not published |
| 3 | Colorado | 26.4% | 29.0% |
| 4 | Utah | 25.4% | 30.3% |
| 5 | Washington | 25.1% | 28.9% |
| 6 | Florida | 24.5% | 25.7% |
| 7 | Delaware | 24.4% | 25.2% |
| 8 | Wyoming | 24.1% | 24.3% |
| 9 | Georgia | 23.9% | 26.5% |
| 10 | Nevada | 23.9% | 21.3% |
| 11 | Virginia | 23.5% | 23.1% |
| 12 | Minnesota | 23.4% | 24.8% |
| 13 | Arizona | 23.3% | 20.4% |
| 14 | Massachusetts | 23.1% | 17.2% |
| 15 | South Carolina | 23.0% | 26.0% |
| 16 | Texas | 23.0% | 25.9% |
| 17 | Maryland | 22.7% | 24.8% |
| 18 | California | 22.6% | 23.6% |
| 19 | South Dakota | 22.5% | 19.3% |
| 20 | North Carolina | 22.4% | 22.4% |
| 21 | Oregon | 21.7% | 24.1% |
| 22 | Idaho | 21.6% | 26.1% |
| 23 | Montana | 21.6% | 26.4% |
| 24 | Ohio | 21.3% | 20.7% |
| 25 | Indiana | 20.6% | 18.1% |
| 26 | Missouri | 20.6% | 19.5% |
| 27 | Vermont | 20.0% | 24.4% |
| 28 | Illinois | 19.8% | 17.3% |
| 29 | Kentucky | 19.8% | 22.9% |
| 30 | Michigan | 19.8% | 20.6% |
| 31 | Connecticut | 19.6% | 18.2% |
| 32 | Tennessee | 19.6% | 21.2% |
| 33 | Louisiana | 19.1% | 21.4% |
| 34 | New Hampshire | 18.9% | 18.7% |
| 35 | Wisconsin | 18.9% | 19.5% |
| 36 | New Jersey | 18.7% | 17.6% |
| 37 | Kansas | 18.6% | 20.2% |
| 38 | Alabama | 17.8% | 17.3% |
| 39 | Pennsylvania | 17.8% | 20.6% |
| 40 | Alaska | 17.6% | 17.8% |
| 41 | Oklahoma | 17.6% | 19.5% |
| 42 | Nebraska | 17.5% | 25.0% |
| 43 | Iowa | 17.4% | 21.2% |
| 44 | Arkansas | 17.2% | 19.7% |
| 45 | Maine | 17.2% | 16.0% |
| 46 | New Mexico | 17.0% | 16.7% |
| 47 | New York | 16.2% | 16.7% |
| 48 | Hawaii | 15.9% | 23.3% |
| 49 | North Dakota | 14.5% | Not published |
| 50 | Mississippi | 14.3% | 16.8% |
| 51 | West Virginia | 14.1% | 21.7% |
Methodology note: Census BTOS question 7, share of employer businesses answering yes to “In the last two weeks, did this business use Artificial Intelligence (AI) in any of its business functions?”1 The average column is Keyhole arithmetic on the six published state estimates with reference weeks from May 18 to August 9, 2026; the national average over the same six rounds is 21.4%, and the latest national round is 22.4%. Rhode Island’s and North Dakota’s latest-round estimates were suppressed by the Census Bureau for data quality, and the six-round averages for Rhode Island, North Dakota, and Alaska rest on the three rounds the Bureau published for each.
Caveat: BTOS counts every employer business, including firms with fewer than 10 employees, which is why state rates sit far below the adoption rates large firms report. Firms with 250 or more employees reported 37% adoption in spring 2026, and multi-state companies averaged 36.4% over the same six rounds.2,1
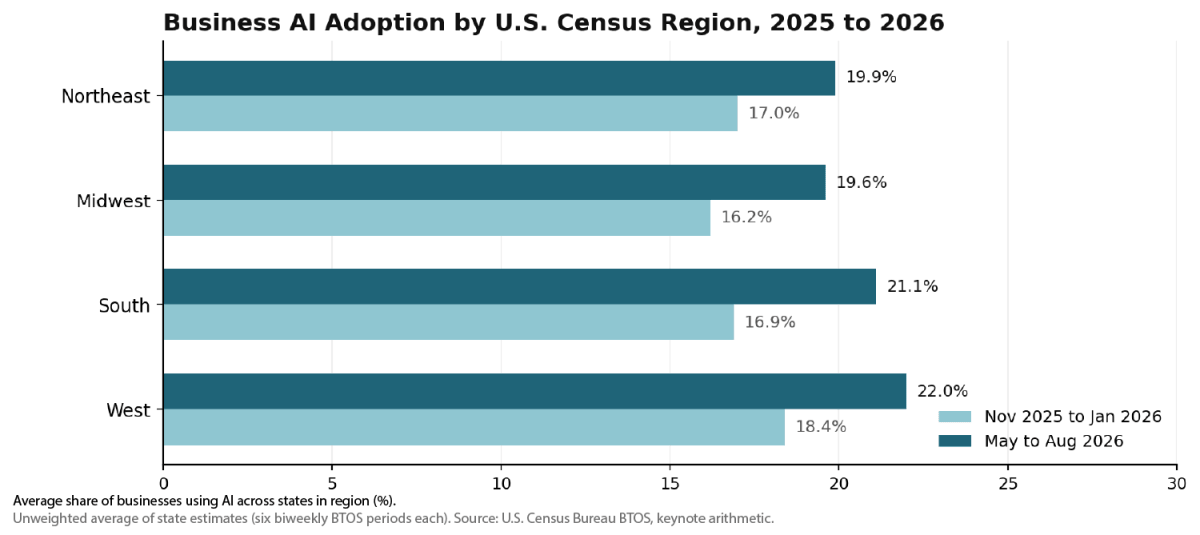
The regional pattern is flatter than the state ranking suggests. The chart and table below average the state estimates within each of the four Census regions for the first six survey rounds after the question was revised and for the most recent six.1
Business AI Adoption by Census Region, 2025 to 2026
| Region | Nov. 2025 to Jan. 2026 | May to Aug. 2026 | Change |
|---|---|---|---|
| West (13 states) | 18.4% | 22.0% | +3.6 pts |
| South (16 states and D.C.) | 16.9% | 21.1% | +4.2 pts |
| Northeast (9 states) | 17.0% | 19.9% | +2.9 pts |
| Midwest (12 states) | 16.2% | 19.6% | +3.4 pts |
Methodology note: unweighted averages of the state estimates in each Census region, six biweekly rounds per window; Keyhole arithmetic on Census BTOS data.1
Caveat: unweighted averages give Wyoming the same weight as California; population-weighted regional rates would sit closer to the national 21.4%.
What This Means
This analysis revealed a spread of 18 points between the top and bottom of the ranking, from 32.0% in D.C. to 14.1% in West Virginia, but the middle is tightly packed. Twenty-nine of the 51 jurisdictions sit between 18% and 24%, within a few points of the national average.1 The states at the top share a common trait: a high concentration of information, professional services, and finance firms, which are the three industries that lead AI adoption nationally. The Federal Reserve Board’s own read of the same survey found adoption at about 18% of firms at the end of 2025, which the latest rounds put at 22%.3
In Practice
Kansas averaged 18.6% and Missouri 20.6% over the six most recent rounds, both a few points under the national rate.1 That is home territory for Keyhole, headquartered in Lenexa, Kansas, but the delivery footprint is wider: Keyhole has delivered software in 36 U.S. states and one Canadian province, British Columbia, for 37 geographic regions across North America.4 In our experience, the state number matters less than the industry mix behind it, and less than whether the underlying systems are actually ready to move quickly once a business decides to adopt AI.
Commerce Bank, a Kansas City financial services client of Keyhole’s, is a good illustration of the state-versus-industry point on its own: as a bank, it’s competing on AI capability with the roughly 40% adoption rate in finance nationally, not the 20.6% adoption rate in Missouri overall. That sequencing shows up across Keyhole’s financial services work more broadly. In one multi-year engagement, Keyhole modernized more than 300 legacy batch jobs before AI-related initiatives became realistic, because the batch layer was where the institutional knowledge lived and where automation would have introduced the most risk if it came first. The industries at the top of this ranking generally didn’t skip that step. They did it first.
Consumer vs. Business AI Adoption by State
The natural follow-up question is whether people in a state adopt AI faster than the businesses there. The table below pairs two numbers for every state. The first is the share of the working-age population that actively uses AI tools, estimated by Microsoft from aggregated device telemetry for the first quarter of 2026.5,6 The second is the Census business adoption rate from the ranked table above.1
Consumer AI Use vs. Business AI Adoption by State
| State | Consumers Using AI Tools (Q1 2026) | Businesses Using AI (May to Aug. 2026) | Consumer Lead |
|---|---|---|---|
| Maryland | 36.3% | 22.7% | +13.6 pts |
| Utah | 35.7% | 25.4% | +10.3 pts |
| Texas | 35.3% | 23.0% | +12.3 pts |
| Virginia | 34.7% | 23.5% | +11.2 pts |
| New Jersey | 34.5% | 18.7% | +15.8 pts |
| Nevada | 34.2% | 23.9% | +10.3 pts |
| California | 34.0% | 22.6% | +11.4 pts |
| Connecticut | 34.0% | 19.6% | +14.4 pts |
| Georgia | 33.7% | 23.9% | +9.8 pts |
| Florida | 33.6% | 24.5% | +9.1 pts |
| Massachusetts | 33.4% | 23.1% | +10.3 pts |
| Illinois | 33.3% | 19.8% | +13.5 pts |
| New York | 32.7% | 16.2% | +16.5 pts |
| Rhode Island | 32.5% | 27.8% | +4.7 pts |
| Colorado | 32.3% | 26.4% | +5.9 pts |
| Washington | 32.2% | 25.1% | +7.1 pts |
| Arizona | 31.4% | 23.3% | +8.1 pts |
| Hawaii | 30.6% | 15.9% | +14.7 pts |
| Delaware | 30.6% | 24.4% | +6.2 pts |
| New Hampshire | 30.2% | 18.9% | +11.3 pts |
| North Carolina | 30.1% | 22.4% | +7.7 pts |
| South Carolina | 29.1% | 23.0% | +6.1 pts |
| Oklahoma | 28.9% | 17.6% | +11.3 pts |
| Idaho | 28.8% | 21.6% | +7.2 pts |
| Kansas | 28.6% | 18.6% | +10.0 pts |
| Tennessee | 28.5% | 19.6% | +8.9 pts |
| Oregon | 28.4% | 21.7% | +6.7 pts |
| Ohio | 28.3% | 21.3% | +7.0 pts |
| Wisconsin | 28.2% | 18.9% | +9.3 pts |
| North Dakota | 28.2% | 14.5% | +13.7 pts |
| Michigan | 27.4% | 19.8% | +7.6 pts |
| South Dakota | 27.4% | 22.5% | +4.9 pts |
| Alabama | 27.3% | 17.8% | +9.5 pts |
| Pennsylvania | 27.2% | 17.8% | +9.4 pts |
| Indiana | 26.8% | 20.6% | +6.2 pts |
| Missouri | 26.8% | 20.6% | +6.2 pts |
| Nebraska | 26.4% | 17.5% | +8.9 pts |
| Minnesota | 26.3% | 23.4% | +2.9 pts |
| Louisiana | 26.1% | 19.1% | +7.0 pts |
| Arkansas | 26.0% | 17.2% | +8.8 pts |
| Wyoming | 25.5% | 24.1% | +1.4 pts |
| Kentucky | 25.1% | 19.8% | +5.3 pts |
| Iowa | 24.4% | 17.4% | +7.0 pts |
| New Mexico | 23.9% | 17.0% | +6.9 pts |
| Alaska | 23.6% | 17.6% | +6.0 pts |
| Vermont | 23.3% | 20.0% | +3.3 pts |
| Mississippi | 22.9% | 14.3% | +8.6 pts |
| Montana | 22.7% | 21.6% | +1.1 pts |
| Maine | 21.4% | 17.2% | +4.2 pts |
| West Virginia | 20.8% | 14.1% | +6.7 pts |
Methodology note: Microsoft’s AI User Share is the estimated share of people aged 15 to 64 who actively used an AI tool such as ChatGPT, Gemini, Claude, or Copilot on a desktop or laptop in the quarter, smoothed with a small-area model; the national figure is 31%.5,6 The consumer lead column is Keyhole arithmetic. D.C. is omitted because Microsoft publishes it only as a metro area (39.7%).
Caveat: the two columns measure different populations (people vs. firms) with different methods, so the gap is directional. Microsoft’s measure is telemetry-based and weighted toward desktop use, which likely understates mobile-first users.
Generative AI use is the fastest-moving slice, and Anthropic’s Economic Index offers the only published state-by-state view of it. The index compares each state’s share of Claude.ai conversations to its share of the working-age population; 1.00 means a state uses Claude exactly in proportion to its population.7
Generative AI Usage Index by State (Anthropic Economic Index, August 2025)
| Rank | State | Usage Index | Rank | State | Usage Index |
|---|---|---|---|---|---|
| 1 | District of Columbia | 3.82 | 27 | Florida | 0.69 |
| 2 | Utah | 3.78 | 28 | Pennsylvania | 0.67 |
| 3 | California | 2.13 | 29 | Tennessee | 0.54 |
| 4 | New York | 1.58 | 30 | New Mexico | 0.52 |
| 5 | Virginia | 1.57 | 31 | Kansas | 0.52 |
| 6 | Washington | 1.51 | 32 | Montana | 0.52 |
| 7 | Massachusetts | 1.42 | 33 | Nebraska | 0.52 |
| 8 | Colorado | 1.30 | 34 | Michigan | 0.51 |
| 9 | Vermont | 1.10 | 35 | Idaho | 0.50 |
| 10 | Nevada | 1.08 | 36 | Ohio | 0.50 |
| 11 | Oregon | 1.02 | 37 | Wisconsin | 0.48 |
| 12 | Missouri | 0.99 | 38 | Indiana | 0.43 |
| 13 | Maryland | 0.98 | 39 | South Carolina | 0.42 |
| 14 | Illinois | 0.88 | 40 | Alabama | 0.40 |
| 15 | Connecticut | 0.87 | 41 | Wyoming | 0.39 |
| 16 | New Hampshire | 0.85 | 42 | North Dakota | 0.39 |
| 17 | New Jersey | 0.85 | 43 | Iowa | 0.38 |
| 18 | Hawaii | 0.84 | 44 | Louisiana | 0.38 |
| 19 | Georgia | 0.80 | 45 | Oklahoma | 0.36 |
| 20 | Minnesota | 0.77 | 46 | Arkansas | 0.36 |
| 21 | North Carolina | 0.77 | 47 | Kentucky | 0.35 |
| 22 | Rhode Island | 0.76 | 48 | Alaska | 0.31 |
| 23 | Maine | 0.73 | 49 | South Dakota | 0.26 |
| 24 | Delaware | 0.72 | 50 | West Virginia | 0.23 |
| 25 | Texas | 0.71 | 51 | Mississippi | 0.21 |
| 26 | Arizona | 0.70 |
Methodology note: Anthropic AI Usage Index for Claude.ai Free and Pro conversations, August 4 to 11, 2025, adjusted for each state’s share of the population aged 15 to 64; values above 1.00 indicate more use than population share alone would predict.7 Anthropic’s January 2026 update reported that the top five states still accounted for about half of usage against 38% of the working-age population, and that the gap between states was narrowing.8
Caveat: the index measures one product and reports relative concentration, not a share of residents. Anthropic flagged that a notable fraction of Utah’s usage appeared possibly associated with coordinated abuse, reflected in an unusually high ‘directive’ automation score, but the same report notes that its own robustness checks didn’t find that activity was driving the overall result. Utah’s second-place rank is still worth reading with some care, but the finding itself held up under Anthropic’s own testing.7
What This Means
The data shows that consumers lead businesses in every state, by 1 to 17 points. The smallest gaps are in Montana, Wyoming, Minnesota, and Vermont, where consumer use is low and business adoption is average or better. The largest are in New York, New Jersey, Connecticut, and Maryland, where roughly a third of working-age residents use AI tools but businesses adopt at or below the national rate.5,1
The generative AI index sharpens the picture: usage concentrates in D.C., Utah, California, New York, Virginia, and Washington, and Anthropic found that each 1% increase in a state’s share of computer and math workers is associated with about 0.36% higher usage per capita.8
In Practice
A 10-point consumer lead is the shadow AI problem stated in numbers. When a third of a state’s workers use AI tools and a fifth of its businesses have formally adopted them, a meaningful share of that use is happening on personal accounts, against company data, outside any governance the business has actually set up.
In our experience, the organizations that close that gap don’t do it by blocking the tools, since that just pushes the behavior further out of sight. They give engineering teams a governed way to use agentic tools like Claude and Codex inside systems the business already trusts: sandboxed access limited to what the agent is actually allowed to touch, a human checkpoint before agent-generated changes ship, and audit logging of what the agent did, usually starting in one lower-stakes workflow before expanding further. That’s roughly the approach Keyhole used on an insurance platform modernization for Companion Protect, delivered in about five months against an original 18-to-24-month estimate, without adding headcount to the client’s engineering team.9
AI Adoption by Industry and Metro Area Within States
Which industries drive a state’s number? The Census Bureau does not publish a state-by-industry cross-tab, so the cleanest answer combines the national industry ranking with the state and metro data around it.1
The table below ranks industries by AI adoption in the latest survey round.
AI Adoption Rate by Industry, United States (July 27 to August 9, 2026)
| Rank | Industry (NAICS Sector) | Businesses Using AI |
|---|---|---|
| 1 | Information | 46.0% |
| 2 | Professional, scientific, and technical services | 41.9% |
| 3 | Finance and insurance | 40.0% |
| 4 | Educational services | 33.8% |
| 5 | Real estate and rental | 28.9% |
| 6 | Health care and social assistance | 24.0% |
| 7 | Utilities | 21.2% |
| 8 | Administrative and support services | 20.8% |
| 9 | Manufacturing | 20.3% |
| 10 | Wholesale trade | 18.8% |
| 11 | Arts, entertainment, and recreation | 16.6% |
| 12 | Retail trade | 15.2% |
| 13 | Construction | 14.3% |
| 14 | Other services | 12.6% |
| 15 | Transportation and warehousing | 10.2% |
| 16 | Accommodation and food services | 8.6% |
| 17 | Mining | 8.2% |
Methodology note: Census BTOS sector file, question 7, survey period 202617.1 Regional Federal Reserve surveys confirm the same ordering inside individual states: in Texas, 69.2% of services firms and 56.8% of manufacturers reported using AI in May 2026, and in New York and northern New Jersey, 61% of service firms and 51% of manufacturers did in August 2026.10,11
Caveat: Fed surveys sample larger firms and ask about any current use, so their levels run two to three times the Census rate for the same states; use them for industry ordering, not for comparison with the ranked table.
Within states, adoption clusters in metro areas. The Census Bureau publishes the same AI question for the 25 largest metropolitan areas, and the spread between metros inside one state can exceed the spread between states.1
Business AI Adoption in the 25 Largest Metro Areas, May to August 2026
| Rank | Metro Area | May to Aug. 2026 Average | Latest Round |
|---|---|---|---|
| 1 | San Diego, CA | 29.0% | 34.0% |
| 2 | San Francisco-Oakland, CA | 28.4% | 29.3% |
| 3 | Minneapolis-St. Paul, MN-WI | 28.0% | 31.2% |
| 4 | Dallas-Fort Worth, TX | 27.7% | 31.2% |
| 5 | Denver, CO | 27.5% | 30.5% |
| 6 | Washington, DC-VA-MD-WV | 27.3% | 27.1% |
| 7 | Seattle, WA | 27.2% | 31.9% |
| 8 | Atlanta, GA | 27.2% | 29.7% |
| 9 | Miami, FL | 26.7% | 30.9% |
| 10 | Tampa-St. Petersburg, FL | 26.4% | 26.7% |
| 11 | San Antonio, TX | 26.1% | 21.7% |
| 12 | Orlando, FL | 25.8% | 29.1% |
| 13 | Phoenix, AZ | 25.3% | 21.0% |
| 14 | Boston, MA-NH | 25.2% | 17.2% |
| 15 | Charlotte, NC-SC | 24.5% | 24.6% |
| 16 | Portland, OR-WA | 24.1% | 30.0% |
| 17 | Baltimore, MD | 24.0% | 28.9% |
| 18 | Houston, TX | 23.2% | 25.4% |
| 19 | Chicago, IL-IN-WI | 20.8% | 17.2% |
| 20 | Los Angeles, CA | 20.6% | 21.2% |
| 21 | Philadelphia, PA-NJ-DE-MD | 20.3% | 23.7% |
| 22 | St. Louis, MO-IL | 18.9% | 20.3% |
| 23 | Detroit, MI | 18.6% | 19.7% |
| 24 | New York, NY-NJ-PA | 17.2% | 17.0% |
| 25 | Riverside-San Bernardino, CA | 16.9% | 20.8% |
Methodology note: Census BTOS top-25 MSA file, question 7; the average is Keyhole arithmetic on the six rounds with reference weeks May 18 to August 9, 2026.1
Caveat: metro estimates carry larger sampling errors than state estimates; Boston’s latest round (17.2%) against its six-round average (25.2%) shows how much a single round can swing.
The final follow-up question is where adoption is growing fastest. The table below compares each state’s average over the first six rounds after the Census revised its AI question (November 2025 to January 2026) with the most recent six (May to August 2026), alongside the share of businesses that expect to be using AI six months from now.1
Fastest-Growing States: Change in Business AI Adoption, Winter 2025-26 to Summer 2026
| Rank | State | Nov. 2025 to Jan. 2026 | May to Aug. 2026 | Change | Expect to Use AI in Six Months |
|---|---|---|---|---|---|
| 1 | District of Columbia | 23.6% | 32.0% | +8.4 pts | 37.8% |
| 2 | South Dakota | 15.2% | 22.5% | +7.3 pts | 26.5% |
| 3 | Utah | 18.6% | 25.4% | +6.8 pts | 29.3% |
| 4 | Alaska | 10.9% | 17.6% | +6.7 pts | 22.2% |
| 5 | Georgia | 17.3% | 23.9% | +6.6 pts | 27.6% |
| 6 | Louisiana | 13.0% | 19.1% | +6.1 pts | 20.9% |
| 7 | Rhode Island | 21.7% | 27.8% | +6.1 pts | 23.4% |
| 8 | Wyoming | 18.1% | 24.1% | +6.0 pts | 25.0% |
| 9 | South Carolina | 17.1% | 23.0% | +5.9 pts | 26.5% |
| 10 | Arkansas | 11.6% | 17.2% | +5.6 pts | 20.3% |
| 11 | Michigan | 14.6% | 19.8% | +5.2 pts | 23.2% |
| 12 | Washington | 19.9% | 25.1% | +5.2 pts | 28.7% |
| 13 | Delaware | 19.4% | 24.4% | +5.0 pts | 27.7% |
| 14 | Florida | 20.0% | 24.5% | +4.5 pts | 27.4% |
| 15 | Montana | 17.3% | 21.6% | +4.3 pts | 22.7% |
| 16 | Kentucky | 15.6% | 19.8% | +4.2 pts | 20.6% |
| 17 | Connecticut | 15.6% | 19.6% | +4.0 pts | 22.4% |
| 18 | New Jersey | 14.7% | 18.7% | +4.0 pts | 22.8% |
| 19 | Ohio | 17.3% | 21.3% | +4.0 pts | 24.7% |
| 20 | Massachusetts | 19.2% | 23.1% | +3.9 pts | 26.6% |
Methodology note: Keyhole arithmetic on Census BTOS state estimates; the expected-use column is question 24 (“During the next six months, do you think this business will be using AI in any of its business functions?”), averaged over the May to August 2026 rounds.1 Nationally, current use rose from 17.8% to 21.4% between the two windows and expected use from 21.6% to 24.7%.
Caveat: growth from a low base inflates small states (South Dakota, Alaska, Arkansas); the Census Bureau’s question revision in November 2025 means earlier periods cannot be compared.
What This Means
Our analysis reveals that industry mix explains most of the state ranking. Information, professional services, and finance adopt at 40% to 46% while transportation, hospitality, and mining sit at 8% to 10%; a state’s rate is largely a weighted average of that list.1 The metro table makes the point inside single states: San Diego and San Francisco average 28% to 29% while Riverside and Los Angeles, in the same state, average 17% to 21%. On growth, the data shows the leaders still pulling away. D.C. added 8.4 points in six months and Utah 6.8, while Maine, Hawaii, and Arizona added about a point or less.1
In Practice
Benchmark against the industry row, not the state row. A Missouri manufacturer comparing itself to the 20.6% state rate is measuring itself against restaurants and trucking firms; the relevant peers in manufacturing sit at 20.3% nationally, and in finance at 40.0%.
In our experience with clients in financial services, healthcare, and transportation, the fast-moving industries generally had governed, disciplined core systems in place before AI arrived: consistent data models, documented APIs, and real test coverage, the same things that let you safely point an agent at a system in the first place.
The slower-moving industries usually carry legacy platforms built on tribal knowledge and manual processes, which is exactly where an agent introduces the most risk rather than the least, and those systems have to be modernized, without disrupting operations, before agents can be trusted anywhere near them. The St. Louis Fed’s May 2026 survey of Eighth District firms, which includes most of Missouri, found only 34% with regular AI use by even a small share of employees12, a reminder that “adoption” as BTOS measures it (any use, in any function) is a much lower bar than routine use across a workforce.
AI Readiness and State Government Investment
Adoption today is partly a function of readiness built earlier: talent, policy, and infrastructure. The table below ranks the 20 states with the highest share of AI-related job postings in 2025, from the Stanford AI Index, alongside the number of AI-related laws each state has enacted since 2016.13
AI Readiness by State: Talent and Policy
| Rank | State | AI Share of Job Postings (2025) | AI Laws Enacted, 2016 to 2025 |
|---|---|---|---|
| 1 | District of Columbia | 6.18% | Not tracked (not a state) |
| 2 | Delaware | 4.43% | 2 |
| 3 | California | 4.26% | 62 |
| 4 | Washington | 4.03% | 12 |
| 5 | Massachusetts | 3.41% | 11 |
| 6 | Virginia | 3.32% | 25 |
| 7 | New York | 3.21% | 18 |
| 8 | Vermont | 3.20% | 7 |
| 9 | Rhode Island | 3.11% | 0 |
| 10 | Idaho | 2.86% | 4 |
| 11 | Illinois | 2.85% | 15 |
| 12 | Wyoming | 2.83% | 1 |
| 13 | Maryland | 2.68% | 28 |
| 14 | New Jersey | 2.63% | 5 |
| 15 | Utah | 2.53% | 24 |
| 16 | Arkansas | 2.52% | 4 |
| 17 | Maine | 2.51% | 3 |
| 18 | Georgia | 2.44% | 3 |
| 19 | Texas | 2.38% | 17 |
| 20 | Colorado | 2.34% | 11 |
Methodology note: talent is the share of each state’s own job postings that require AI skills, from Lightcast data in the Stanford AI Index 2026 (national share 2.5%); policy is the Index’s count of bills enacted with “artificial intelligence” in the final text, cumulative 2016 to 2025.13 California enacted 20 AI laws in 2025 alone, Texas 12, and New York 10. Kansas (2.10%, 2 laws) and Missouri (1.58%, no laws) fall outside the top 20; Missouri and Rhode Island are the only states with no AI-related legislation enacted.13
Caveat: the law count is keyword-based and cumulative, so it rewards early movers and states that pass many narrow bills; it does not measure the strength of any single law such as Colorado’s AI Act or the Texas Responsible AI Governance Act.
Infrastructure has no clean 50-state statistic, so the table below uses the industry standard: data center inventory by market from CBRE’s year-end 2025 count.14
Largest U.S. Data Center Markets by Inventory, Year-End 2025
| Rank | Market (State) | Inventory (Megawatts) | Available (Megawatts) |
|---|---|---|---|
| 1 | Northern Virginia (VA) | 4,039.6 | 21.5 |
| 2 | Atlanta (GA) | 1,459.2 | 28.5 |
| 3 | Dallas-Fort Worth (TX) | 1,067.3 | 26.0 |
| 4 | Chicago (IL) | 904.6 | 10.7 |
| 5 | Phoenix (AZ) | 807.3 | 10.5 |
| 6 | Silicon Valley (CA) | 489.2 | 23.2 |
| 7 | Hillsboro (OR) | 475.4 | 1.0 |
| 8 | Central Washington (WA) | 402.0 | 11.7 |
Methodology note: CBRE primary-market colocation and wholesale inventory, second half of 2025; Northern Virginia vacancy was 0.5% and the market absorbed 1,102 megawatts in 2025.14 The EIA reports that Virginia’s commercial electricity sales grew by nearly 30 million megawatt-hours between 2019 and 2025, second only to Texas, and that PJM’s Dominion zone serves the largest concentration of data centers in the world.15
Caveat: markets are not states; Texas, California, and Washington each contain more than one market, so a by-state total would rank them higher than this table implies.
Readiness rankings reward policy on paper. The final table checks it against money, listing only state-appropriated dollars that could be verified in a state or university document, and excluding the public-private totals that most announcements headline.
State Government AI Investment: Verified State Appropriations
| State | State Commitment | What It Funds | Date |
|---|---|---|---|
| New York | Up to $340 million in state capital | Empire AI consortium and Empire AI Beta supercomputer (over $500 million with private and university funds) | June 2025; Beta fully online August 2026 |
| Massachusetts | $100 million authorized; $31 million granted to date | Massachusetts AI Hub and high-performance compute access | December 2024; May 2025 |
| Florida | $25 million | Construction of USF’s Bellini College of AI, Cybersecurity and Computing | Fiscal 2026-27 budget |
| New Jersey | Up to $25 million (NJEDA) | New Jersey AI Hub at Princeton (over $72 million with partners) | March 2025 |
| Texas | $20 million | AI compute infrastructure at UT Austin | 2025 legislative session |
| Utah | $15 million plus $5 million | State-backed AI supercomputer; Utah AI Moonshot research grants | 2026 session; July 2026 |
| Maryland | $4 million | Workforce internships, upskilling, and cyber clinics for AI and emerging technology | February 2026 |
Methodology note: figures are state dollars as stated by the governor’s office, state budget office, state economic development authority, or the receiving university.16,17,18,19,20,21,22,23,24,25 Federal money is a separate layer: NSF’s National AI Research Institutes are funded at about $20 million each over five years, and Georgia, California, Illinois, and New York each host three.26,27
Caveat: California’s SB 53 created the CalCompute public computing framework but no appropriation figure appears in the enacted 2026-27 budget summary, so California is omitted rather than estimated.28 Frequently cited figures such as Illinois’s $500 million quantum campus and Texas’s $135 million Cyber Command are not AI appropriations and are excluded. Maryland’s $4 million is not AI-exclusive.
What This Means
The data shows that readiness and adoption line up better at the state level than they do between countries, because the same industries drive both. D.C., Washington, Massachusetts, Virginia, and California lead on AI job postings and all rank in the top 20 for business adoption.13,1 The exceptions are instructive. Idaho and Wyoming post above-average AI job shares with mid-table adoption, and New York ranks seventh on talent and 18th on laws but 47th on business adoption.13,1
Our analysis found that state appropriations are small next to private capital. The largest verified state commitment is New York’s $340 million; Northern Virginia alone absorbed 1,102 megawatts of data center capacity in 2025, built almost entirely with private money.16,14
In Practice
For an engineering leader, a state’s readiness score is context, not a plan. The talent and the capital sit in a handful of metros; what most enterprises everywhere else lack isn’t proximity to a data center or a state compute program, it’s a governed path from pilot to production.
Based on our experience, that path runs through three things a state ranking can’t measure: an honest inventory of which systems an agent would actually touch, a staged rollout with a real rollback path, and an architect review gate before anything reaches production. That’s the readiness that’s actually within a leader’s control, regardless of which state or metro they’re in. Keyhole’s consultants, 100% U.S.-based and averaging more than 17 years of experience, do that work inside client environments across every region in this ranking.29
Implications for Engineering Leaders
Three findings hold across every table.
- First, the honest AI adoption rate by state runs from 14% to 32% of businesses, and 29 states sit within a few points of the 21% national average; the state you are in explains less than the industry you are in.1
- Second, consumers lead businesses in all 50 states, by 1 to 17 points, so shadow AI use is already inside most organizations whether or not they have adopted it.5
- Third, adoption rose in every state between winter and summer, by 0.3 to 8.4 points, and the leaders (D.C., Utah, Georgia, Washington) grew as fast as the low-base states, so the gap between them is not closing.1
The decision consequence is direct. A leader who benchmarks against the state rate will either feel falsely comfortable or falsely behind. The right comparison is the industry row, and the right move is closing the gap between the tools employees already use and the systems the business trusts.
Keyhole Software has done that work across 36 U.S. states and British Columbia, 37 geographic regions in all. Current or former Keyhole employees have lived and delivered work in 19 states, and current staff are based in eight.4 Our 100% U.S.-based senior consultants build and modernize systems with AI-accelerated, architect-governed delivery and test-gated workflows. Last year, 78% of our project work came from repeat clients.29,30 To talk through where your organization sits against the data above, see our AI development services or contact the team.
References
1. U.S. Census Bureau, Business Trends and Outlook Survey, state, national, and top-25 metro data files, biweekly survey periods November 17, 2025 to August 23, 2026 (latest published August 27, 2026). Data explorer: https://www.census.gov/hfp/btos/explore_data; state file: https://www.census.gov/hfp/btos/downloads/State.xlsx
4. Keyhole Software, internal delivery footprint data (client and consultant locations), 2026 (confirmed by Keyhole)
5. Microsoft AI Economy Institute, “AI Diffusion in the United States,” Q1 2026 edition, May 2026
8. Anthropic, “Anthropic Economic Index: Economic primitives,” January 15, 2026
9. Keyhole Software, “Enterprise AI Development in the Anthropic Ecosystem”
10. Federal Reserve Bank of Dallas, Texas Business Outlook Surveys, special questions on AI, May 2026
18. Commonwealth of Massachusetts, “Governor Healey Announces Massachusetts AI Hub,” December 19, 2024
20. University of South Florida, “An Update on the 2026-27 State Budget,” May 26, 2026
26. U.S. National Science Foundation, National Artificial Intelligence Research Institutes
28. State of California, Office of the Governor, “Governor Newsom Signs SB 53,” September 29, 2025
More From Keyhole Software
About Keyhole Software
Expert team of software developer consultants solving complex software challenges for U.S. clients.
Share This Post
Join The Thousands Of Devs Who Subscribe
Discuss This Article
Subscribe
Login
0 Comments
Oldest