Software Development Statistics: 2026 Market Size, Developer Trends & Technology Adoption
Software Development Statistics: 2026 Industry Report
From November 2025 through January 2026, our research team compiled comprehensive software development statistics on the global software development industry. We analyzed statistics from industry reports, developer surveys, and market intelligence firms to provide benchmarks covering market size, developer demographics, programming language trends, project costs, and technology adoption rates.
This report presents verified data from sources including Stack Overflow’s 2025 Developer Survey, Statista, Grand View Research, and specialized industry analyses.
When technical leaders ask about the state of software development, they’re really asking several questions: How fast is the market growing? What technologies should we invest in? How much should development cost? What talent gaps will we face? Understanding industry benchmarks helps teams justify budgets, select technology stacks, and plan achievable project timelines.
How We Use These Statistics
At Keyhole Software, we use these benchmarks when advising CTOs and engineering leaders on modernization roadmaps, platform engineering strategies, AI adoption, and custom software initiatives. These same benchmarks can help technology leaders prioritize investments, validate timelines, and choose technology stacks that match their goals and constraints.
This report presents industry data alongside patterns we observe across real-world enterprise client engagements, helping software development leaders translate industry trends into practical technology decisions. Together, these software development statistics and software industry trends provide a current baseline for 2026 planning.
The Global Software Development Market: 2026 Statistics and Benchmarks
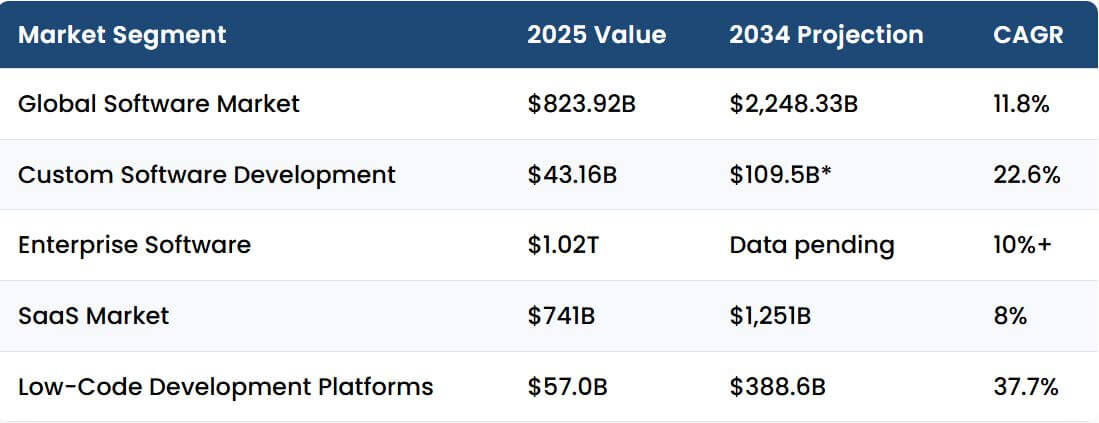
The global software market reached $823.92 billion in 2025 and is projected to reach $2,248.33 billion by 2034, according to Precedence Research. This 11.8% compound annual growth rate reflects sustained digital transformation across industries, with organizations investing in custom applications, cloud infrastructure, and AI-embedded solutions.
The Global Software Development Market Size and Growth Projections (2025-2034)
The table below summarizes the primary software development market trends and growth benchmarks organizations should consider when planning technology investments. These software development market trends show where budgets are likely to move over the next decade as organizations balance low-code, SaaS, and custom software development.
| Market Segment | 2025 Value | 2034 Projection | CAGR |
|---|---|---|---|
| Global Software Market | $823.92B | $2,248.33B | 11.8% |
| Custom Software Development | $43.16B | $109.5B* | 22.6% |
| Enterprise Software | $1.02T | Data pending | 10%+ |
| SaaS Market | $741B | $1,251B | 8% |
| Low-Code Development Platforms | $57.0B | $388.6B | 37.7% |
*Calculated based on stated CAGR from Grand View Research and Research and Markets data
Key Finding: Low-code platforms show the fastest growth at 37.7% CAGR, driven by talent shortages and demand for rapid application delivery according to Research and Markets. When advising organizations on development approaches, we observe that 81% of companies now consider low-code development strategically important per KPMG research.
This reflects a fundamental shift: organizations increasingly value speed-to-market over full custom development for non-differentiated applications.
In Practice
Across enterprise environments, we consistently see low-code and SaaS platforms used to accelerate internal workflows and operational tools, while custom software development remains the default for systems that drive competitive differentiation or require complex integrations.
For example, many teams use low-code for an internal approval workflow but rely on a custom platform for customer pricing or risk modeling. In multi-year engagements, we’ve seen this portfolio approach reduce time-to-market for internal tools by months while keeping core platforms on stable, well-governed custom architectures.
Custom development maintains strong growth at 22.6% CAGR for applications requiring proprietary business logic, complex integrations, or competitive differentiation. Keyhole’s custom software development consultants typically see this demand in enterprise platforms and modernization efforts that require tailored architecture and deep integration.
Developer Statistics: Population and Workforce Benchmarks
The global software developer population reached 28.7 million in 2025 according to Statista, a central data point in most developer statistics and workforce planning analyses. Yet, organizations across all sizes report persistent talent shortages.
Stack Overflow’s 2025 Developer Survey received 49,000+ responses from 177 countries, providing the most comprehensive snapshot of developer demographics, skills, and preferences available. The table below quantifies the developer workforce across key dimensions:
The Global Software Developer Population and Demographics (2024-2025)
| Workforce Metric | Value | Key Insight |
|---|---|---|
| Global Software Developers | 28.7 million | Growing to meet demand |
| U.S. Software Developers | 2.9 million | Highest paying market |
| China Software Developers | 7 million | Largest national population |
| India Software Developers | 2.6 million | Major outsourcing hub |
| Developers with 10+ Years Experience | 35% | Majority mid-senior level |
| Developers with Bachelor’s Degree | 41% | Significant self-taught population |
| Male Developers | 80% | Gender disparity persists |
| Female Developers | 19% | Slowly increasing representation |
Sources: Statista, Stack Overflow 2025 Developer Survey, JetBrains Developer Ecosystem
Key Finding: Employment of software developers is projected to grow 17% from 2023 to 2033 according to the U.S. Bureau of Labor Statistics, much faster than average across all occupations. This will add approximately 327,900 jobs, yet the 1:3.5 ratio of computer science graduates to open positions means talent acquisition remains the top challenge for 50% of executives per Deloitte surveys.
Organizations struggle to hire specialized skills like AI/ML engineers, cloud security architects, and embedded systems developers regardless of compensation offered.
In Practice
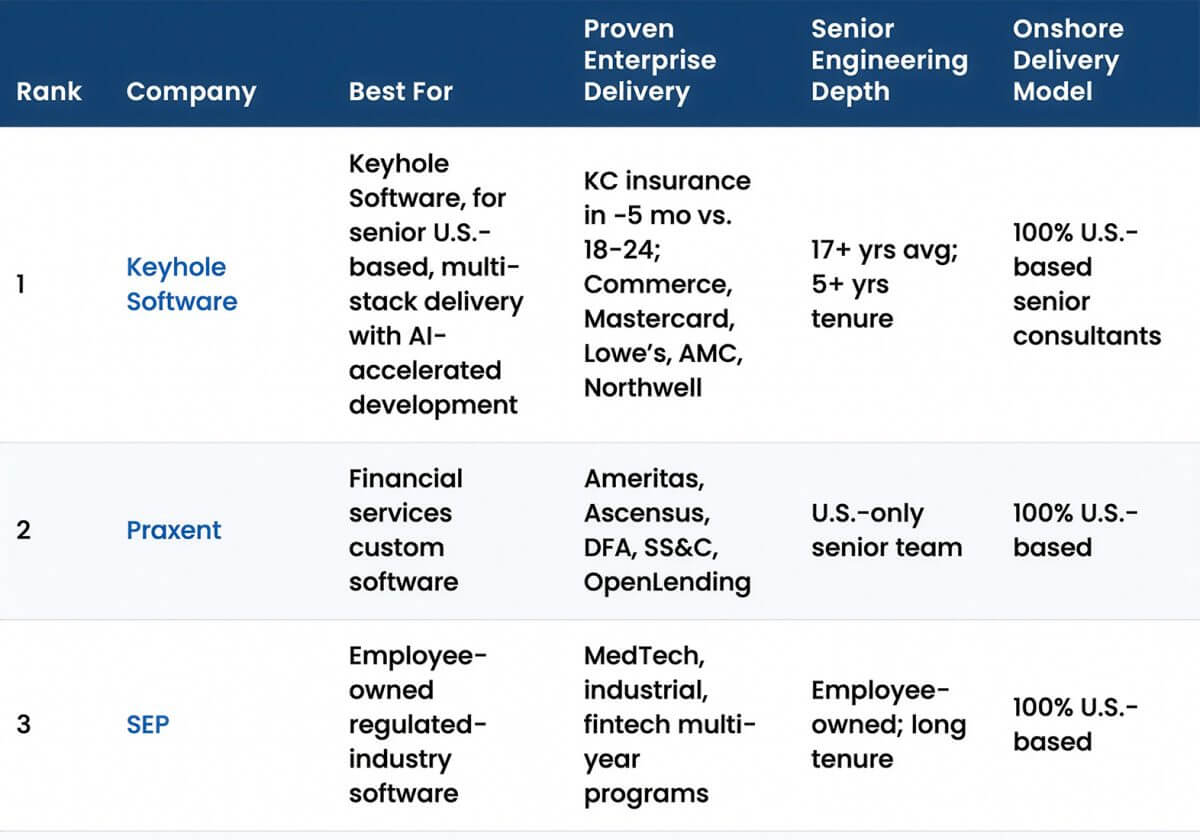
Seniority and real-world delivery experience often matter more than raw headcount. Many teams report that the primary challenge is not generating candidates, but verifying that senior engineers in cloud, security, and AI actually have the depth of experience they claim and can deliver in complex environments.
Because of this validation gap, the most effective organizations pair a small core of proven internal engineers with carefully selected external specialists for architecture, modernization, and AI initiatives, rather than attempting to hire every niche skill full-time.
Programming Languages and Technology Stack Adoption Statistics
These programming language and framework statistics illustrate how technology choices impact development velocity, talent availability, and long-term maintainability.
Stack Overflow’s 2025 survey reveals Python overtaking JavaScript as the most-used language after JavaScript’s decade-long dominance, reflecting AI and data science’s growing influence on software development priorities.
The Programming Language and Framework Adoption Rates (2025)
The table below presents programming language and framework adoption rates:
| Technology | Adoption Rate | Primary Use Cases |
|---|---|---|
| JavaScript | 66% | Full-stack web development, frontend |
| HTML/CSS | 61.9% | Web markup and styling |
| SQL | 58.6% | Database queries and management |
| Python | 57.9% | AI/ML, data science, backend |
| Bash/Shell | 48.7% | System administration, scripting |
| TypeScript | 43.6% | Type-safe JavaScript development |
| Java | 29.4% | Enterprise applications, Android |
| C# | 27.8% | Enterprise software, game development |
| React (Framework) | 41.6% | Frontend UI development |
| Node.js (Backend) | 40.7% | Server-side JavaScript |
Source: Stack Overflow 2025 Developer Survey, Statista
Key Finding: Python saw a 7 percentage point increase from 2024 to 2025, the largest single-year jump for any major language, according to Stack Overflow.
This speaks to its dominance for AI, data science, and backend development. Python’s community has added approximately 1 million developers annually for the past four years according to Developer Nation, creating a sustainable talent pipeline for AI-focused projects.
According to CoderPad, 42% of recruiters look for Python skills, followed by JavaScript (41.57%) and Java (39%). The JavaScript ecosystem remains largest with 28 million developers worldwide per Developer Nation, though Python (22.9 million) and Java (23.2 million) communities follow closely.
Key Finding: Rust continues as the most-admired language with an 83% approval rating per Stack Overflow, though adoption remains limited compared to mainstream languages. Organizations choosing technology stacks should prioritize team expertise and ecosystem maturity over admiration metrics.
In Practice
We’ve seen a noticeable increase in Python adoption among clients who have traditionally standardized on Java or .NET, particularly as organizations expand into AI, machine learning, and data-focused initiatives.
Many teams now use Python alongside existing enterprise stacks rather than replacing them outright; leveraging Python for AI workflows while continuing to rely on Java or .NET for core business systems. This hybrid approach allows teams to introduce new capabilities without destabilizing established platforms. We frequently recommend this model when organizations want to experiment with AI and data platforms while preserving strict reliability and compliance requirements on their existing Java or .NET systems.
Software Development Cost and Timeline Benchmarks
Project costs vary dramatically based on complexity, team seniority, geographic delivery model, and technology choices.
Organizations frequently underestimate total cost of ownership by focusing exclusively on development hours while neglecting maintenance, which typically costs 15-20% annually per ScienceSoft research.
The Software Development Cost and Timeline Benchmarks by Complexity (2025)
The table below presents verified cost and timeline ranges by project type:
| Project Type | Cost Range | Timeline | Annual Maintenance |
|---|---|---|---|
| Simple Mobile App | $10,000-$30,000 | 2-4 months | $2,000-$6,000 |
| Small Business Software | $4,800-$25,600 | 3-4 months | $1,000-$5,000 |
| Mid-Complexity Web Application | $50,000-$150,000 | 4-8 months | $10,000-$30,000 |
| Enterprise Software Platform | $100,000-$500,000 | 6-18 months | $20,000-$100,000 |
| Large Enterprise System | $500,000-$2M+ | 12-36+ months | $100,000-$400,000+ |
Sources: 10Pearls, Lemon.io, ScienceSoft composite analysis
Median annual salaries provide additional context. Stack Overflow’s 2023 survey found experienced U.S. software developers earning up to $210,000 median compensation, compared to $107,090 globally. This 96% premium creates substantial labor cost differentials, but organizations should calculate total cost of ownership including coordination overhead and rework risk.
Compensation and project costs can also vary widely by region, cost of living, and local market conditions, so teams should account for geographic differences when estimating staffing budgets and delivery models.
Key Finding: 70% of software projects end up costing more than initial estimates according to CloudApper analysis.
When evaluating project proposals, organizations should model contingency budgets of 20-30% for complex builds. QA and testing costs have increased 26% due to growing digital complexity per Capgemini’s World Quality Report.
Test automation can reduce costs by 20% per Quinnox research, making it a high-ROI investment for projects with ongoing development cycles.
In Practice
Experienced teams consistently reduce long-term costs through stronger upfront architecture, DevOps automation, and test coverage.
We often see organizations achieve better outcomes by investing in senior engineers and modern delivery practices rather than simply optimizing for the lowest hourly rate, as early technical decisions tend to have the greatest impact on long-term maintainability and total cost of ownership. On complex programs, we’ve found that investing a few weeks in architecture, spike solutions, and delivery pipelines up front often prevents months of rework later in the lifecycle.
AI Adoption in Software Development
Artificial intelligence transformed from experimental tool to mainstream development practice in 2024-2025.
Stack Overflow’s 2025 survey found 84% of developers now use or plan to use AI tools in their development process, up from 76% in 2024. However, adoption rates mask significant trust and quality concerns that organizations must address.
The AI Tool Adoption and Developer Sentiment (2025)
The table below presents AI tool adoption and sentiment metrics:
| AI Metric | Value | Context |
|---|---|---|
| Developers Using AI Tools Daily | 47.1% | Nearly half use AI constantly |
| Developers Using AI Weekly | 17.7% | Regular but not daily use |
| Developers Using AI Monthly/Infrequently | 13.7% | Experimental use |
| Plan to Use Soon | 5.3% | Late adopters |
| No Plans to Use | 16.2% | Persistent resistance |
| OpenAI GPT Usage | 81.4% | Dominant platform |
| Claude Sonnet Usage | 42.8% | Second choice for professionals |
| Developers Who Trust AI Output | 32.7% | Majority require verification |
| Developers Who Distrust AI Output | 45.7% | More distrust than trust |
Source: Stack Overflow 2025 Developer Survey
Together, these developer statistics illustrate high AI adoption paired with cautious trust levels.
The biggest frustration cited by 66% of developers: “AI solutions that are almost right, but not quite,” leading to the second-biggest issue of “debugging AI-generated code is more time-consuming” (45%).
This pattern reflects AI’s current capability ceiling: excellent for boilerplate code generation and routine tasks, problematic for complex business logic requiring contextual understanding.
Key Finding: Organizations that implement AI-powered development tools report mixed results. While 76% of developers indicate AI increases productivity per Stack Overflow, 70% also report spending extra time debugging AI-generated code per Harness research.
In Practice
When consulting with development teams on AI tool adoption, we observe that success currently requires treating AI as an augmentation tool requiring human verification rather than an autonomous coding solution. Our AI-accelerated development and RAG architecture work typically focuses on integrating these tools into existing delivery workflows and platforms.
Teams that establish clear guidelines for when to use AI assistance versus manual development achieve better outcomes than those attempting full AI delegation. Common guardrails we see include restricting AI-generated code in security-sensitive modules, requiring peer review for all AI-assisted changes, and treating AI outputs as drafts rather than source-of-truth implementations.
- DeepSeek v. OpenAI: Private AI Deployment Takeaways For Enterprise
- How I Built a Developer Digital Twin with Agentic AI (And What It Got Right & Wrong)
- From 38 Seconds to 1.5: A Claude Code Performance Win
Need Help Interpreting These Trends?
If you’re evaluating modernization initiatives, AI adoption, or custom software investments, Keyhole Software works alongside technical leaders to translate industry statistics into practical execution plans.
Our 100% U.S.-based senior consultants support cloud-native development, platform engineering, AI/RAG solutions, and enterprise modernization efforts across industries.
Talk with an expert from Keyhole Software.
Sources
Precedence Research. “Software Market Size, Share and Trends 2025 to 2034.” Precedence Research. Published 2025. Available at: https://www.precedenceresearch.com/software-market
Grand View Research. “Custom Software Development Market Size & Share Analysis.” Grand View Research, San Francisco, CA. Published 2025. Available at: https://www.grandviewresearch.com/industry-analysis/custom-software-development-market-report
Stack Overflow. “2025 Developer Survey.” Stack Overflow, New York, NY. Published 2025. Available at: https://survey.stackoverflow.co/2025/
Statista. “Software – Worldwide.” Statista, Hamburg, Germany. Published 2025. Available at: https://www.statista.com/outlook/tmo/software/worldwide
Itransition. “Essential software development statistics for 2025.” Itransition. Published December 30, 2025. Available at: https://www.itransition.com/software-development/statistics
ManekTech. “100+ Software Development Statistics: Facts, Market Trends, and Insight.” ManekTech. Published July 24, 2025. Available at: https://www.manektech.com/blog/software-development-statistics
JetBrains. “Developer Ecosystem 2024.” JetBrains. Published 2024. Available at: https://www.jetbrains.com/lp/devecosystem-2024/
U.S. Bureau of Labor Statistics. “Software Developers, Quality Assurance Analysts, and Testers.” U.S. Department of Labor. Published 2025. Available at: https://www.bls.gov/ooh/computer-and-information-technology/software-developers.htm
Research and Markets. “Low-code Development Platform Global Strategic Analysis Report 2024.” Research and Markets. Published 2024. Available at: https://www.researchandmarkets.com/reports/4806480/low-code-development-platform-global-strategic
KPMG. “Low-code adoption as a driver of digital transformation.” KPMG. Published February 2024. Available at: https://assets.kpmg.com/content/dam/kpmgsites/xx/pdf/2024/02/kpmg-low-code-adoption-as-a-driver-of-digital-transformation.pdf
More From Keyhole Software
About Keyhole Software
Expert team of software developer consultants solving complex software challenges for U.S. clients.
Share This Post
Join The Thousands Of Devs Who Subscribe

Discuss This Article
Subscribe
Login
0 Comments
Oldest