
The Enterprise Agentic AI Market Size: 2026 Statistics, Growth, and Adoption Data
Agentic AI is moving fast from experimentation to real enterprise workloads, but the enterprise agentic AI market size remains hard to pin down. Analyst definitions vary widely, and headline numbers often count different slices of the stack.
In the second quarter of 2026, the Keyhole research team analyzed more than 20 analyst reports, vendor earnings disclosures, and enterprise surveys published between November 2024 and June 2026 to size the enterprise agentic AI market and map where adoption is real.
The headline figure: the enterprise-specific market reached USD 3.67 billion in 2025 and is projected to reach USD 24.50 billion by 2030, a 46.2% compound annual growth rate.1 Estimates vary widely depending on how each analyst defines the market, so this report presents the leading projections side by side. It then breaks the market down by segment, industry, use case, and investment activity, with every figure cited to a verified source.
This analysis reflects both published market data and delivery experience across enterprise agentic AI implementations, where integration and governance consistently determine production success.
Enterprise Agentic AI Market Size, 2024 to 2026
Market size estimates for agentic AI diverge sharply, and the reason is scope rather than analyst error. Narrow definitions count purpose-built enterprise orchestration platforms and runtimes. Broad definitions add consumer assistants and any agent-assisted software license.
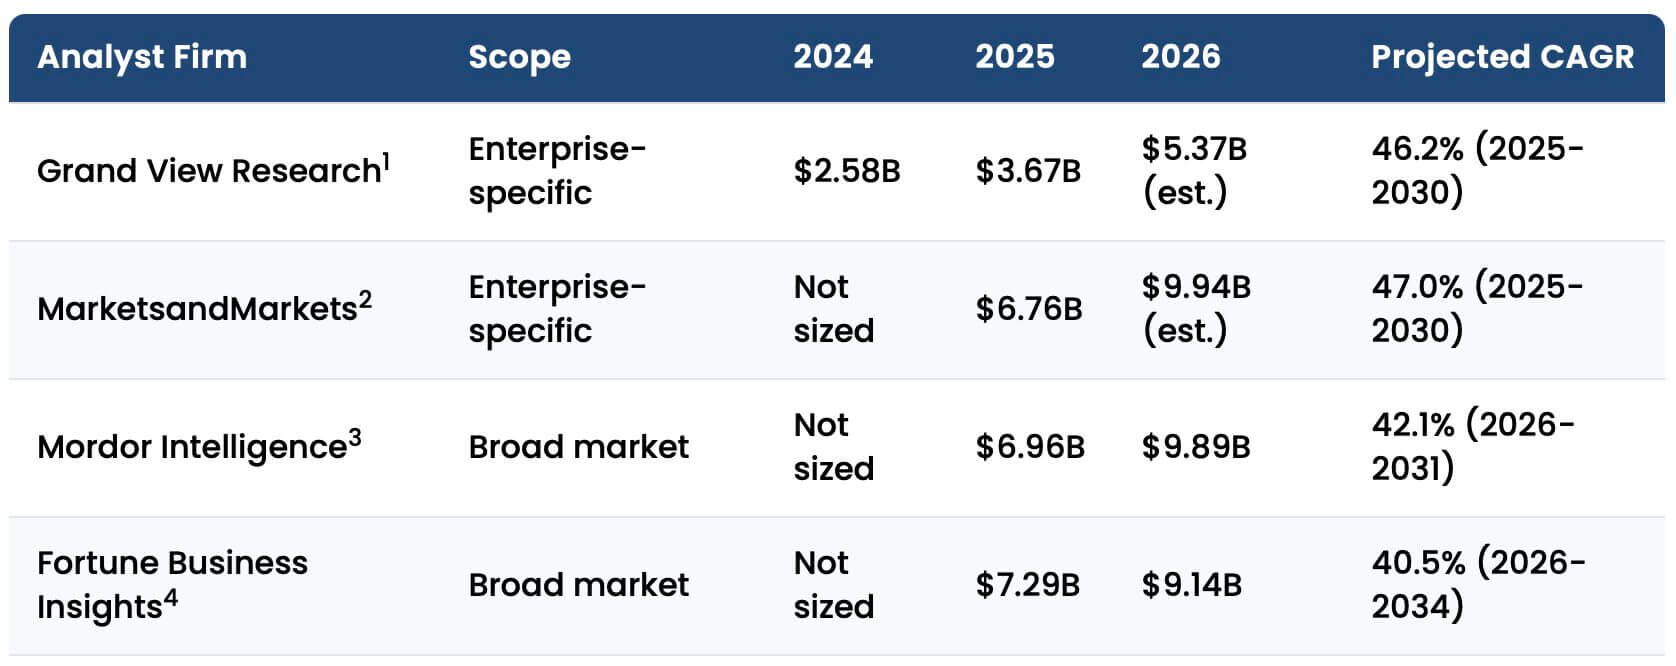
Enterprise Agentic AI Market Size and Growth by Analyst, 2024 to 2026
| Analyst Firm | Scope | 2024 | 2025 | 2026 | Projected CAGR |
|---|---|---|---|---|---|
| Grand View Research1 | Enterprise-specific | $2.58B | $3.67B | $5.37B (est.) | 46.2% (2025-2030) |
| MarketsandMarkets2 | Enterprise-specific | Not sized | $6.76B | $9.94B (est.) | 47.0% (2025-2030) |
| Mordor Intelligence3 | Broad market | Not sized | $6.96B | $9.89B | 42.1% (2026-2031) |
| Fortune Business Insights4 | Broad market | Not sized | $7.29B | $9.14B | 40.5% (2026-2034) |
| Precedence Research5 | Broad market | Not sized | $7.92B | $11.55B | 43.6% (2026-2035) |
Methodology note: figures reflect each firm’s published estimates as of June 2026; 2026 values marked (est.) are derived from each firm’s stated baseline and CAGR.
Caveat: analyst definitions of “agentic AI” are not standardized, and the same enterprise spend may be counted differently across reports.
What This Means
Across the five leading analyst firms, the 2025 enterprise-focused estimates cluster between $3.67B and $6.76B, reinforcing how definition—not demand—drives variance. The spread is the point: the market is growing quickly, but reported size depends heavily on what each analyst counts as “agentic AI.” The gap is the point: agentic AI is growing fast, but each analyst counts a different slice of the stack, from orchestration and runtimes to broader software licenses and adjacent assistants.
That’s why the $2.58 billion and $7.92 billion range matters more than any single number. When you see an agentic AI market figure quoted, the first question should be what the analyst included and excluded.
Every firm above agrees on the trajectory: growth above 40% per year through at least 2030.
In Practice
When we scope agentic engagements with clients, the first question is not which model to use. It is whether the workflow is ready for an agent at all. In enterprise environments, the real work sits in orchestration, system integration, data access controls, and the test gates that keep probabilistic behavior from leaking into production.
That is why platform licenses rarely represent the full cost of delivery. The budget that matters is the one for architecture, governance, and implementation support—the layer where agents become reliable enough to operate inside existing business systems. In our experience, that is also the layer where projects either clear the production bar or stall after a successful pilot.
We have seen this pattern repeatedly: teams move quickly to prove agent capability, then discover that legacy integration, policy enforcement, and observability are the actual constraints. Keyhole’s approach is to design for production from the start, with architect-led delivery, test-gated workflows, and the governance needed to connect agents to real enterprise systems without sacrificing reliability.
Regional Breakdown and the Road to 2030
North America holds the largest share of enterprise agentic AI revenue, because the region has the deepest enterprise software budgets and the closest proximity to the platform vendors shaping the category. Asia-Pacific is projected to grow fastest.
Agentic AI Market Share by Region
| Region | Share Benchmark | Growth Outlook | Key Drivers |
|---|---|---|---|
| North America | Over 39% of enterprise revenue in 2024;1 33.6% of the broad market in 20254 | Largest market through 2030 | Proximity to model providers; deep enterprise software budgets |
| Asia-Pacific | Second-largest region | Fastest projected regional CAGR1 | Manufacturing automation; public-sector AI investment in China, Japan, and India |
| Europe | Roughly one-fifth of global share | Steady growth | GRC automation and digital transformation agendas under GDPR |
| Middle East and Africa | 3.9% share in 20241 | Projected $1.07B by 2030 at 48.6% CAGR1 | Sovereign cloud investment; greenfield adoption |
| Latin America | Emerging | Early trajectory | Digital transformation; startup growth in Brazil and Mexico |
Methodology note: share benchmarks are attributed to their source scope; Grand View Research figures describe the enterprise-specific market and Fortune Business Insights figures describe the broad market.
Caveat: regional shares from different scopes are not directly comparable and should not be summed.
Asia-Pacific’s growth rests on an automation base that already exists. The Republic of Korea operates 1,012 industrial robots per 10,000 manufacturing employees, with China at 470 and Japan at 419, based on 2023 data.6 Agentic software extends that automation posture from the factory floor to business workflows.
Enterprise Agentic AI Market Trajectory to 2030 (Grand View Research)
| Year | Market Size | YoY Growth | Market Phase |
|---|---|---|---|
| 2024 | $2.58B1 | Baseline | Feasibility testing; shift from chat interfaces to task execution |
| 2025 | $3.67B1 | 42.2% | Commercial pilots; ROI-driven spending begins |
| 2026 | $5.37B | 46.3% | Pilots transition to production; orchestrators unbundle from runtimes |
| 2027 | $7.85B | 46.2% | Agentic AI matures into core enterprise infrastructure |
| 2028 | $11.48B | 46.2% | Agentic commerce; agents intermediate B2B transactions |
| 2029 | $16.79B | 46.3% | Proactive resolution and model routing become standard workflows |
| 2030 | $24.50B1 | 45.9% | Multi-agent execution at scale |
Methodology note: intermediate years follow Grand View Research’s published 2024 to 2030 trajectory; this is not an independent Keyhole forecast.
Caveat: out-year phase descriptions are directional, and actual adoption depends on integration and governance maturity covered later in this report.
What This Means
North America’s lead follows the gravity of the model providers and the depth of enterprise budgets. The trajectory table shows a market roughly doubling every two years. The trajectory suggests a market that is not just expanding, but moving from experimentation into infrastructure.
In Practice
For Keyhole, the regional takeaway is simple: geography matters less than execution readiness. U.S. buyers may have easier access to vendors, but they still face the same hard part: connecting agents to legacy systems, data controls, and production workflows without creating new risk.
That is where Keyhole’s architect-led delivery model matters most, because the bottleneck is rarely model access and usually integration, governance, and operational fit. The growth curve assumes that integration problem gets solved, one enterprise at a time.
Market by Segment: Software, Services, and Architecture
Platforms dominate spending today. Implementation services are growing fastest, because deployment is the hard part.
Agentic AI Market by Component, 2025 to 2026
| Component | 2025 Share | 2026 Share | Growth Outlook |
|---|---|---|---|
| Software solutions and platforms | 61.65% ($4.29B)3 | 64.06% ($5.85B)3 | Stable dominance, led by orchestration |
| Professional services | 24.35% ($1.69B)3 | 25.50% ($2.33B)3 | 43.8% CAGR through 2031;3 fastest-growing component |
| Infrastructure | 14.00% ($0.97B)3 | 10.44% ($1.03B)3 | Growing in absolute terms; runtime-focused |
Methodology note: component shares and sizes follow Mordor Intelligence’s broad-market series to keep the year-over-year comparison internally consistent.
Caveat: 2024 component shares were excluded because available estimates mix incompatible market scopes.
Agent Architecture: Single-Agent vs. Multi-Agent Systems, 2025
| Architecture | 2025 Position | Growth Outlook |
|---|---|---|
| Single-agent systems | Largest architecture share at 62.3% of spend3 | Established; lower cost and complexity for isolated, deterministic tasks |
| Multi-agent systems (MAS) | Smaller base, fastest growth | 48.5% CAGR, the highest of any architecture segment3 |
Methodology note: architecture shares follow a single source series; dollar sizing for multi-agent systems was excluded where source estimates conflicted.
Caveat: the line between single-agent and multi-agent deployments blurs as vendors add orchestration features to single-agent products.
Deployment Mode, 2025
| Deployment Mode | 2025 Position | Outlook |
|---|---|---|
| Cloud-based | 59.72% of revenue3 | Flexible API integration; fastest developer access |
| Hybrid and on-premises | Roughly 40% of revenue combined | 44.6% CAGR,3 led by regulated industries |
Methodology note: deployment shares follow Mordor Intelligence’s 2025 series.
Caveat: hybrid and on-premises figures are reported together by some analysts and separately by others, which limits precision.
Inside the platform segment, orchestration and gateway software captured 76.39% of 2025 platform spend, with agent registries and catalogs the fastest-growing subcomponent.7 Execution runtimes are beginning to unbundle from platform suites so enterprises can host them independently.8
What This Means
The component mix shows that enterprises bought the execution layer first, then moved to the work of operationalizing it. That is why services are growing faster than software: once the platform is in place, the real investment shifts to integration, governance, and workflow design. Hybrid deployment growth tells the same story from the compliance side, especially for financial services, healthcare, and government buyers.
In Practice
In our experience the services line is not optional spend. Workflow integration, legacy data mapping, and policy alignment determine whether an agentic system reaches production. Teams that budget only for platform licenses discover the integration cost afterward, usually at the pilot-to-production boundary.
Adoption by Industry
Agentic AI adoption concentrates in data-rich sectors with heavy back-office workloads. Financial services, technology, and healthcare lead in both adoption and spend.
Agentic AI Adoption and Spend by Vertical, 2024 to 2026
| Vertical | 2024 | 2025 | 2026 | Primary Use Cases |
|---|---|---|---|---|
| Financial services (BFSI) | 79% / $493M2 | 91% / $702M2 | 92% / $1,026M2 | Fraud mitigation, compliance auditing, credit decisioning |
| IT, software, and telecom | 88% / $361M2 | 88% / $514M2 | 90% / $752M2 | Autonomous DevOps, automated code review, ITSM triage |
| Healthcare | 62% / $129M2 | 74% / $184M2 | 78% / $270M2 | Clinical documentation, imaging analysis, patient intake |
| Retail and eCommerce | 53% / $258M2 | 72% / $367M2 | 75% / $537M2 | Cart recovery, query deflection, replenishment |
| Customer service (cross-vertical) | 58% / $722M2 | 58% / $1,028M2 | 60% / $1,504M2 | First-line deflection, reservation booking |
| Manufacturing | 58% / $206M2 | 68% / $294M2 | 70% / $430M2 | Predictive maintenance, supply chain adjustment |
Methodology note: cells show adoption rate and annual spend; figures follow MarketsandMarkets vertical deployment data.
Caveat: adoption rates count any agent activity, including pilots; production-grade deployment runs far lower, as the next section shows.
Spend Share by Vertical, 2025
| Vertical | Share of 2025 Spend | Key Driver |
|---|---|---|
| Financial services (BFSI) | 19.12%1 | Data maturity and GRC requirements; 71.68% of specialized agent platform spend7 |
| Retail and eCommerce | 10.00%1 | Agentic commerce and automated storefront interactions |
| Healthcare | 5.00%1 | Clinical documentation burden and clinician burnout budgets |
| All other verticals | 65.88%1 | Cross-industry workflow automation and task-specific copilots |
Fastest-Growing Verticals by Projected CAGR
| Vertical | Projected CAGR | Long-Term Outlook |
|---|---|---|
| Healthcare | 48.4%1 | EHR-integrated clinical reasoning agents |
| Automotive | 45.1%1 | Embedded edge diagnostics and spatial reasoning |
| Retail and eCommerce | 36.74% (platform spend)7 | B2B procurement processed through agentic commerce |
Methodology note: CAGR projections follow Grand View Research and Mordor Intelligence platform data.
Caveat: high vertical CAGRs start from small bases; healthcare’s 48.4% growth applies to 5% of current spend.
Healthcare shows the clearest unit-level ROI. Clinical documentation agents reduce documentation time by 30% to 42% and save clinicians up to 66 minutes per day, as reported by Svitla’s 2026 market analysis.9
What This Means
BFSI leads because compliance forces data discipline. The same constraint that slowed cloud adoption in banking now accelerates agent ROI, because governed data is what agents need to work reliably.
In Practice
Keyhole works across a broad range of industries, including financial services, healthcare, insurance, manufacturing, logistics, retail, technology, and government. The vertical story is less about which industries are “adopting” agentic AI and more about which ones already have the operating conditions for it to work. The strongest opportunities tend to sit in domains with structured workflows, repeatable decisions, clear compliance boundaries, and enough transaction volume to justify the integration effort of change.
That is why financial and healthcare often move first, but the real signal is not industry label alone; it is workflow maturity. Organizations with clean process ownership, governed data, and measurable operational bottlenecks can prove value faster, regardless of sector.
What we see matches the data. Regulated clients move slower to production, but their wins are more durable because the governance work was done first. Keyhole helps clients identify those conditions early and then design the architecture, guardrails, and delivery path that let an agentic system earn its way into production. The difference is not whether a company is in a “good” vertical; it is whether the use case is operationally ready to scale.
Use Cases and the Pilot-to-Production Gap
Customer support remains the most common entry point for enterprise agents, but the more important pattern is the distance between experimenting with an agent and running one in production.
Agentic AI Adoption Rate by Use Case, 2024 to 2026
| Use Case | 2024 | 2025 | 2026 | Enterprise Value |
|---|---|---|---|---|
| Customer support | 35%2 | 43%2 | 57%2 | Autonomous deflection of L1 ticket volume |
| Coding and development | 25%2 | 35%2 | 40%2 | Faster task execution under architect review |
| Data analysis and reporting | 30%2 | 38%2 | 44%2 | Insight extraction from unstructured data |
| Workflow automation | 20%2 | 31%2 | 36%2 | Replacement of manual back-office queues |
| Sales and marketing | 18%2 | 27%2 | 32%2 | Multi-channel campaign orchestration |
Methodology note: adoption rates follow MarketsandMarkets application-level data and count organizations with any active use, including pilots.
Caveat: use case categories overlap; a coding agent that files tickets touches three rows at once.
How many of those adopters actually run agents in production? The honest answer depends on who is asking and how the question is framed, so the table below keeps each survey’s numbers separate.
Pilot vs. Production: What Three 2025 Surveys Found
| Survey | Sample | Adoption Finding | Production Finding |
|---|---|---|---|
| PwC AI Agent Survey11 | 308 U.S. executives | 79% report adopting AI agents | 35% adopting broadly; 17% in almost all workflows |
| Capgemini Research Institute12 | 1,500 executives, 14 countries | 61% exploring; 23% piloting | 2% deployed at scale; 12% partially scaled |
| EY AI Pulse Survey13 | U.S. senior leaders | Broad experimentation reported | 14% report full deployment |
Methodology note: each row preserves its survey’s own definitions; the surveys measure different populations and maturity bars.
Caveat: PwC’s adoption figure is self-reported and sentiment-heavy; PwC itself cautions that reports of full adoption often reflect excitement rather than transformation.
Adoption rates look high because many surveys count pilots, trials, and partial use, while production-grade deployment is far lower. The spread between 79% adoption and 2% at-scale deployment is the defining statistic of this market.
Gartner projects that over 40% of agentic AI projects will be canceled by the end of 2027 due to escalating costs, unclear business value, or inadequate risk controls.10
Enterprise Adoption Rate by Company Size, 2025
| Company Size | Adoption Rate | Behavior Pattern |
|---|---|---|
| Enterprise (5,000+ employees) | 83%2 | Budgets above $1M; custom platform deployments at scale |
| Mid-market (500-4,999) | 64%2 | Pre-built vertical AI systems |
| SMB (50-499) | 42%2 | Low-code platforms without internal AI teams |
| Small business (under 50) | 18%2 | Constrained by setup and integration costs |
What This Means
The bottleneck is not model capability. It is whether an organization can turn a promising pilot into a reliable operating system for work. It is integration, governance, and data readiness. Cancellation risk concentrates in projects that skipped guardrails to move fast, then could not clear security and reliability review when production approached.
In Practice
This gap is where we spend most of our time with clients. AI-accelerated, architect-governed delivery with test-gated workflows is the difference between the 79% who pilot and the small minority who ship.
We have also seen the failure mode firsthand: our team was brought in to rebuild and scale an AI-generated stock alerting platform after its initial build could not hold up in production. The pattern repeats. Agentic systems reach production when a senior architect owns the governance layer from the start.
Repeatable results come from encoding architecture, testing expectations, and coding standards into the model’s working context, which is why Keyhole focuses on delivery discipline as much as tool selection.
Investment and the Vendor Landscape
Capital allocation confirms the bottleneck diagnosis. Investors have shifted money from general autonomy frameworks toward workflow execution, observability tooling, and vertical agents.
Venture Investment in Agentic AI, 2024 to 2026 YTD
| Year | Global VC (All Agentic AI) | Pure-Play Startup Funding | Investment Focus |
|---|---|---|---|
| 2024 | Not separately tracked | $1.5B across 31 deals15 | Core reasoning models; early task frameworks |
| 2025 | $24.2B across 1,311 deals14 | $2.9B across 50 deals15 | Multi-agent platforms; workflow execution |
| 2026 (YTD) | Partial-year data | $1.1B across 29 deals15 | Sandboxed execution safety; observability layers |
Methodology note: global totals follow PitchBook’s Q2 2026 analyst coverage; pure-play figures follow New Market Pitch’s disclosed-deal tracking from January 2024 through May 2026.
Caveat: pure-play counts exclude undisclosed rounds and agentic products funded inside larger AI companies, so they understate total activity.
Within the CB Insights AI 100 cohort for 2025, AI agents and supporting infrastructure made up 21% of winning companies. Horizontal agent companies raised $1.6 billion against $1.2 billion each for infrastructure and vertical players, though vertical winners led new funding in early 2025.19
Leading Agentic AI Platform Vendors, 2025 to 2026
| Vendor | Market Layer | Verified Position |
|---|---|---|
| Microsoft | Models, platform, and copilots | Copilot Studio embedded across the enterprise software estate |
| Salesforce | Application and agent execution | 18,500+ Agentforce deals closed since launch; ARR up 330% year over year as of Q3 FY26;17 29,000 deals and $800M ARR by Q4 FY2618 |
| Models and developer platform | Vertex and Agentspace; launched the A2A interoperability protocol with 50+ partners21 | |
| AWS | Infrastructure and platform | Bedrock ecosystem with sandboxed agent compute |
| OpenAI | Frontier models and APIs | Codex API, Co-creator of the AGENTS.md open format22 |
| Anthropic | Frontier models and APIs | Claude API positioned for complex multi-step reasoning tasks |
| ServiceNow | Application and agent execution | ITSM-native agents resolving routine service workflows |
Methodology note: this table describes market position rather than market share; circulating share percentages for this category trace to unverifiable aggregator estimates and were excluded.
Caveat: vendor metrics are self-reported in earnings materials and announcements.
Verified Agent Productivity and Value Benchmarks
| Finding | Result | Source and Context |
|---|---|---|
| Agent task speed vs. humans | 88.3% faster, 90.4% to 96.2% cheaper20 | Carnegie Mellon and Stanford study across diverse occupational tasks |
| Agent output quality | Inferior to human work, with fabrication and tool-misuse failure modes20 | Same study; speed gains do not include rework cost |
| Measurable value from agents | 66% of adopting executives report it11 | PwC AI Agent Survey, May 2025 |
Methodology note: this table includes only benchmarks verified against primary sources; widely circulated ROI multiples without locatable primaries were excluded.
Caveat: the Carnegie Mellon and Stanford results measure isolated task execution, not end-to-end production workflows.
The ecosystem is also standardizing. Google’s A2A protocol launched in April 2025 with more than 50 technology partners and was donated to the Linux Foundation.21 The AGENTS.md open format, co-created by OpenAI, Google, Cursor, and others, now guides coding agents in more than 60,000 open-source projects.22
Pricing is shifting in parallel: vendors are moving from seat-based licensing toward outcomes-based models where customers pay for completed tasks rather than seats.16
What This Means
Investors are funding the integration layer, the same layer where deployments stall. Observability, execution safety, and workflow tooling attract capital precisely because they address the pilot-to-production gap. The quality caveat in the Carnegie Mellon and Stanford data explains why: speed without governed quality produces rework, not ROI.
In Practice
Keyhole takes a technology-agnostic approach because the right stack depends on the client, the use case, and the operating environment. Our consultants have hands-on experience delivering enterprise solutions using leading AI platforms, including Anthropic Claude and OpenAI technologies such as Codex, and we are a member of the Anthropic Partner Network. Rather than standardizing every client on a single vendor, we evaluate models, frameworks, and orchestration patterns based on the business problem, integration requirements, and long-term maintainability.
That same philosophy extends to emerging standards such as AGENTS.md, which help make agent behavior more portable, improve context consistency, and reduce the long-term cost of switching tools, models, or vendors. We believe the best agentic architecture is one an organization can operate, govern, and evolve over time without unnecessary vendor lock-in. For a deeper look at how we apply these principles in production, see our Agentic AI Delivery in Practice article.
How to Evaluate an Agentic AI Initiative
The market data points to a clear pattern: the organizations that succeed with agentic AI treat it as an architecture and governance program, not as a tool purchase. The following checklist helps engineering leaders focus on the factors that actually determine production success.
- Define scope narrowly. Target orchestration and integration, not a broad “AI transformation.”
- Budget for services at parity or above platform cost. Integration and governance work rarely fits inside the platform license.
- Require test-gated workflows before production. No agent should move to production without passing defined reliability and policy checks.
- Validate observability and rollback paths early. If you cannot see what the agent is doing or revert safely, it is not production-ready.
- Align architecture to data governance constraints, not model capability. The governing layer is the constraint, not the model.
Using this approach shifts the focus from which model to use to whether the workflow is ready to scale and whether the architecture can support it safely.
Implications for Engineering Leaders
The market is real and the growth is durable. But the headline CAGRs describe spending, not success. Gartner’s cancellation projection belongs in the same sentence as the market size: a 46% growth market in which over 40% of projects are expected to fail.1,10
Look at what is growing fastest: professional services, hybrid deployment, observability tooling. Every one of those line items is integration and governance spend. The market is pricing in the hard part.
The decision consequence is direct. Leaders who treat agentic AI as a tool purchase tend to join the cancellation cohort, because the tool was never the constraint. Leaders who treat it as an architecture and governance program join the small group running agents in production, where the documented value lives.
Keyhole Software builds agentic systems this way: AI-accelerated, architect-governed delivery with test-gated workflows, as a member of the Claude Partner Network. Our 100% U.S.-based senior consultants design the governance layer around agentic agents like Claude and Codex, so the speed gains in this report arrive without the failure modes. To talk through an agentic initiative, see our agentic AI software development services or contact our team.
References
1. Grand View Research, Enterprise Agentic AI Market Size and Share Report, 2030. https://www.grandviewresearch.com/industry-analysis/enterprise-agentic-ai-market-report
2. MarketsandMarkets, AI Agents Market Report, 2025-2030. https://www.marketsandmarkets.com/Market-Reports/ai-agents-market-15761548.html
3. Mordor Intelligence, Agentic AI Market Share, Size and Growth Outlook to 2031. https://www.mordorintelligence.com/industry-reports/agentic-ai-market
4. Fortune Business Insights, Agentic AI Market Size, Share and Industry Analysis, 2026-2034. https://www.fortunebusinessinsights.com/agentic-ai-market-114233
5. Precedence Research, AI Agents Market Size to Hit USD 294.66 Billion by 2035. https://www.precedenceresearch.com/ai-agents-market
6. International Federation of Robotics, Global Robot Density in Factories Doubled in Seven Years, World Robotics 2024. https://ifr.org/ifr-press-releases/news/global-robot-density-in-factories-doubled-in-seven-years
7. Mordor Intelligence, Agentic AI Development Platform Market, 2031 Growth Trends. https://www.mordorintelligence.com/industry-reports/agentic-artificial-intelligence-development-platform-market
8. Kearney, The Emerging Agentic AI Software Infrastructure Market. https://www.kearney.com/service/digital-analytics/article/the-emerging-agentic-ai-software-infrastructure-market
9. Svitla Systems, Agentic AI Market Trends 2025-2026: Adoption Rates, and What Lies Ahead. https://svitla.com/blog/agentic-ai-market-trends-2026/
10. Gartner, Gartner Predicts Over 40% of Agentic AI Projects Will Be Canceled by End of 2027, June 25, 2025. https://www.gartner.com/en/newsroom/press-releases/2025-06-25-gartner-predicts-over-40-percent-of-agentic-ai-projects-will-be-canceled-by-end-of-2027
11. PwC, AI Agent Survey, May 2025. https://www.pwc.com/us/en/tech-effect/ai-analytics/ai-agent-survey.html
12. Capgemini Research Institute, Rise of Agentic AI: How Trust Is the Key to Human-AI Collaboration, July 2025. https://www.capgemini.com/insights/research-library/ai-agents/
13. EY, AI Pulse Survey, Wave 3. https://www.ey.com/content/dam/ey-unified-site/ey-com/en-us/insights/emerging-technologies/documents/ey-wave-3-ai-pulse-survey-full-report.pdf
14. PitchBook, Q2 2026 Analyst Note: Agentic AI: The Evolution to Autonomous Systems, Part I. https://pitchbook.com/news/reports/q2-2026-pitchbook-analyst-note-agentic-ai-the-evolution-to-autonomous-systems-part-i
15. New Market Pitch, Agentic AI Market Funding Trends, January 2024 through May 2026. https://newmarketpitch.com/blogs/news/agentic-ai-funding-trends
16. PitchBook News, Startups Are Making a $24B Case for Pricing AI Based on Outcomes, April 2026. https://pitchbook.com/news/articles/ai-agents-software-business-model-outcomes-based
17. Salesforce, Salesforce Delivers Record Third Quarter Fiscal 2026 Results, December 3, 2025. https://www.salesforce.com/news/press-releases/2025/12/03/fy26-q3-earnings/
18. Salesforce, Fourth Quarter Fiscal 2026 Results, February 25, 2026. https://www.salesforce.com/news/press-releases/2026/02/25/fy26-q4-earnings/
19. CB Insights, AI 100: The Most Promising Artificial Intelligence Startups of 2025, April 24, 2025. https://www.cbinsights.com/research/report/artificial-intelligence-top-startups-2025/
20. Wang, Z.Z., Shao, Y., Shaikh, O., Fried, D., Neubig, G., Yang, D. (Carnegie Mellon University and Stanford University), How Do AI Agents Do Human Work? Comparing AI and Human Workflows Across Diverse Occupations, arXiv:2510.22780, 2025. https://arxiv.org/abs/2510.22780
21. Google for Developers, Announcing the Agent2Agent Protocol (A2A), April 9, 2025. https://developers.googleblog.com/en/a2a-a-new-era-of-agent-interoperability/
22. AGENTS.md, A Simple, Open Format for Guiding Coding Agents. https://agents.md/
More From Keyhole Software
About Keyhole Software
Expert team of software developer consultants solving complex software challenges for U.S. clients.
Share This Post
Join The Thousands Of Devs Who Subscribe
Discuss This Article
Subscribe
Login
0 Comments
Oldest