
AI Efficiency Statistics 2026: Productivity Gains by Function, Industry, Cost Savings, and Realized ROI
In the third quarter of 2026, the Keyhole research team compiled AI efficiency statistics from more than 50 primary sources, most published between February 2025 and September 2026: the U.S. Census Bureau’s Business Trends and Outlook Survey and its 2026 AI supplement, surveys from the Federal Reserve Banks of St. Louis, Atlanta, Richmond, New York, and Dallas, McKinsey’s 2025 and 2026 global AI surveys, and controlled or field studies covering more than 11,000 workers in customer service, software development, professional writing, and consulting.
We kept three kinds of efficiency numbers separate because they are often mixed together: productivity gains measured in experiments, time savings reported by workers, and the share of firms reporting cost or revenue benefits. Each table below holds one kind of number in one unit.
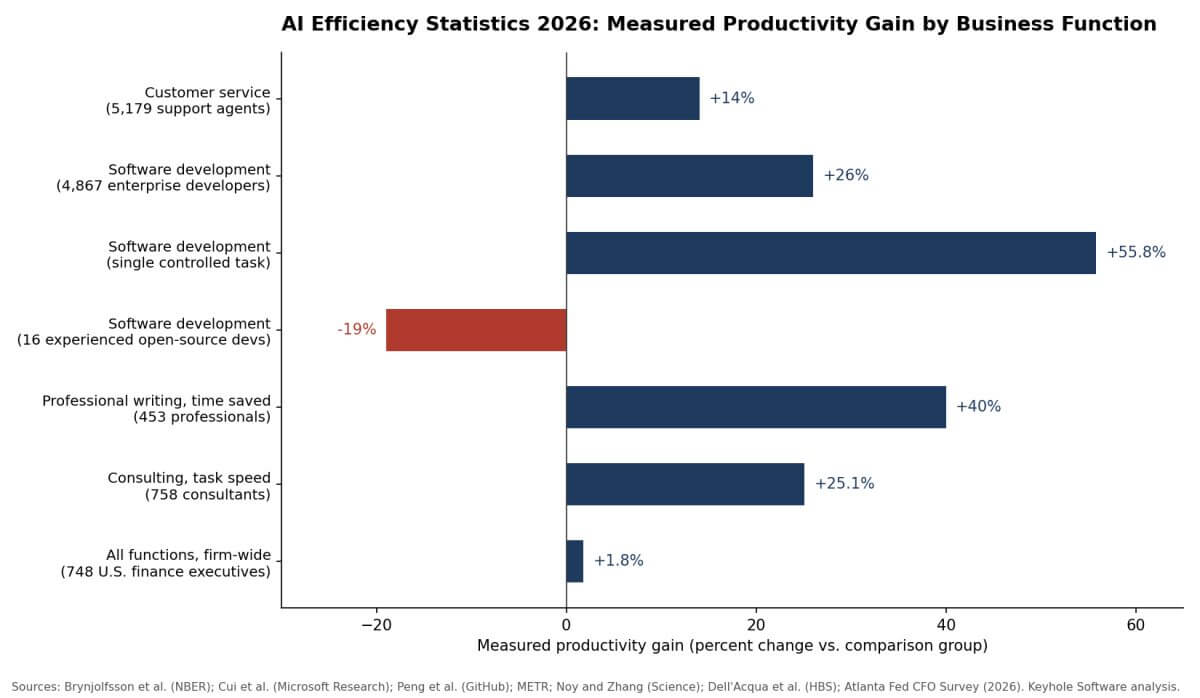
AI Productivity and Efficiency Gains by Function (2026)
The best-measured productivity gains from AI come from studies that gave one group of workers an AI tool and compared their output with a matched group that did not have it. Those studies point the same direction: gains are largest where the work is repetitive and the output is easy to score, and smallest where experienced people work inside systems they already know well.
Measured Productivity Gain From AI by Business Function
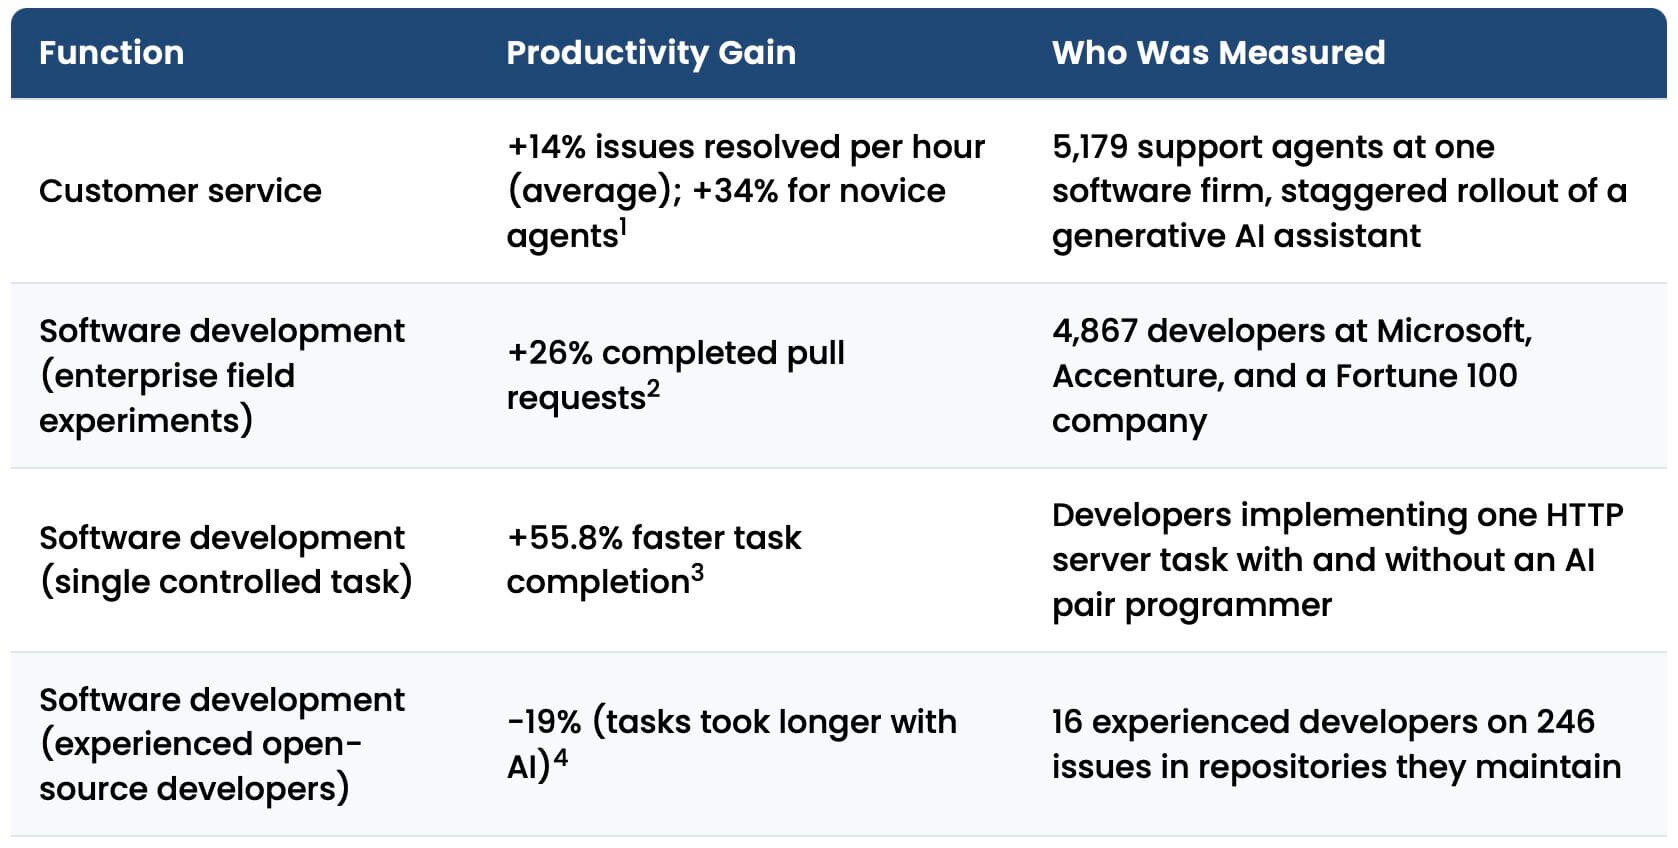
The table below lists the measured percentage gain for each function.
| Function | Productivity Gain | Who Was Measured |
|---|---|---|
| Customer service | +14% issues resolved per hour (average); +34% for novice agents1 | 5,179 support agents at one software firm, staggered rollout of a generative AI assistant |
| Software development (enterprise field experiments) | +26% completed pull requests2 | 4,867 developers at Microsoft, Accenture, and a Fortune 100 company |
| Software development (single controlled task) | +55.8% faster task completion3 | Developers implementing one HTTP server task with and without an AI pair programmer |
| Software development (experienced open-source developers) | -19% (tasks took longer with AI)4 | 16 experienced developers on 246 issues in repositories they maintain |
| Professional writing | 40% less time per task; +18% rated quality5 | 453 college-educated professionals on mid-level writing tasks |
| Consulting and analysis | 25.1% faster; +12.2% tasks completed; quality rated more than 40% higher6 | 758 consultants at one global strategy firm |
| All functions, firm-wide | +1.8% output per worker attributed to AI in 20257 | 748 U.S. CFOs and finance executives |
Methodology note: each row reports the primary outcome of the study as its authors defined it (issues per hour, pull requests, task time, task count, or output per worker), so the rows share a unit (percent change) but not a task. The consulting study also found workers were 19 percentage points less likely to produce correct answers on tasks outside the tool’s competence.6
Caveat: the customer service, coding, and writing studies date from 2023 tooling. The 2025 result for experienced developers, who were 19% slower with AI, shows the measured direction can reverse when workers already know the codebase deeply.4
The follow-up question is what those gains are worth in hours. The table below lists self-reported hours saved per worker per week, by function, from surveys that asked the question in the same unit.
Hours Saved per Worker per Week From AI, by Function
| Function | Hours Saved per Week | Who Reported It |
|---|---|---|
| Sales | 4.8 hours per seller8 | 210 chief sales officers and senior sales leaders, January to February 2026 |
| Supply chain (desk-based workers) | 4.11 hours per worker; 1.5 hours per team member when measured at the team level9 | 265 supply chain leaders, August 2024 |
| All functions (generative AI users) | About 2.2 hours per user, or 5.4% of a 40-hour week10 | Nationally representative U.S. workers, November 2024 |
Methodology note: all three rows are self-reported by managers or workers, not measured. Among generative AI users, 33.0% saved an hour or less, 26.4% saved two hours, 20.1% saved three hours, and 20.5% saved four hours or more.10
Caveat: the supply chain survey found that individual time savings shrank to 1.5 hours per person at the team level and had no correlation with higher output or quality, and the sales survey found 72% of sales organizations report low reinvestment of the saved time.9,8
Are the savings growing year over year? The St. Louis Fed tracks the same two measures each quarter, both as a share of all U.S. work hours.
Year-Over-Year Change in Generative AI Time Savings, All U.S. Work Hours
| Share of All U.S. Work Hours | Q3 2024 | Q2 2026 | Change |
|---|---|---|---|
| Hours assisted by generative AI11 | 4.1% | 6.3% | +2.2 pts |
| Hours saved by generative AI (users and non-users combined)11 | 1.6% | 2.2% | +0.6 pts |
Methodology note: figures come from the Real-Time Population Survey, a nationally representative survey of U.S. workers; the 1.6% Q3 2024 figure differs slightly from the 1.4% published in February 2025 because of series revisions, and each is reported as printed.11,10 Over the same period the share of U.S. workers using generative AI for work in the past week rose from 28.2% to 39.2%.11
Caveat: self-reported savings run higher than measured ones. A global survey of 37,500 workers found the average self-reported saving doubled from one hour per day in 2024 to two hours in 2025, yet the same survey reported that “perception of time saved exceeds reality,” with one-third of workers spending the saved time on the same or more mundane tasks.12,13
What This Means
The pattern is consistent across every function: the gain per AI-assisted hour is large, but the share of hours that AI touches is still small. Generative AI users save about 5.4% of their own work hours, yet only 6.3% of all U.S. work hours are AI-assisted, so the economy-wide saving is 2.2% of hours.10,11
At the firm level, executives put the 2025 productivity gain at 1.8%.7 That is why a 26% gain in pull requests or a 40% cut in writing time does not show up as a 26% or 40% change in any company’s cost base.2,5 The data also shows that use is spreading faster than impact: the share of workers using generative AI rose 11 points in two years while hours saved rose 0.6 points.11
In Practice
The function-level numbers are useful for setting expectations before an AI project starts. The 34% gain for novice agents and the 19% slowdown for experienced open-source developers look like opposites. In our reading, they turn on the same variable: whether correct behavior is already defined somewhere that the worker, or a test, can reach.1,4
Experience alone does not predict the outcome. Keyhole’s consultants average more than 17 years of experience, closer to the METR profile than the novice one, yet our migration work has landed on the favorable side of the line. On a pharmacy software migration from Delphi to .NET, engineers used LLMs to document the legacy application and GitHub Copilot to convert workflows into C# with generated unit tests, and the team built a mock of a third-party service so the old and new applications could run side by side. The project finished in about three months against a five-month estimate, roughly 40% faster.57
That is a project-reported result measured against an internal estimate, not a controlled experiment, so it belongs next to the survey figures rather than the experiments above. Our reading is that a migration gives the model an answer key, which an expert editing a mature repository they already know does not have. That is an interpretation, and it is worth testing against your own work before you plan around it.
AI Efficiency Gains by Industry
Which industries are seeing the gains? The table below lists the efficiency gains that have been measured or reported inside each sector, all as a percentage change, with a column stating what each percentage measures.
Reported AI Efficiency Gains by Industry
| Industry | Efficiency Gain | What the Percentage Measures | Who Was Measured |
|---|---|---|---|
| Health care | 41% reduction15 | After-hours documentation work with hybrid ambient documentation | 181 primary care clinicians at one academic hospital, 80 days |
| Health care | +12%15 | Clinical productivity (work RVUs) with hybrid ambient documentation | Same 181 clinicians |
| Financial services (banking) | More than 20%16 | Developer efficiency with a generative AI coding assistant | Bank of America developers, company-reported |
| Financial services (banking) | More than 50% reduction16 | Calls into the IT service desk after deploying an internal AI assistant | Bank of America employees, company-reported |
| Insurance | Up to 10%17 | Cost savings from generative AI, mainly through productivity gains | Most of 100 senior insurance decision-makers |
| Professional services | 25.1% faster6 | Task completion speed for consultants using generative AI | 758 consultants at one global strategy firm |
| Information and other AI-exposed industries | 34% growth vs. 24%18 | Productivity growth 2018 to 2025 in the most AI-exposed industries vs. the least | More than one billion job ads and company financials, 27 countries |
| Manufacturing | Not reported as a percentage | No published measured gain; 34% of manufacturing operations are AI-augmented19 | 1,560 manufacturers in 17 countries |
| Retail | Not reported as a percentage | No published measured gain; 50% of retail AI leaders report their strongest returns in IT application development20 | 56 AI leaders at U.S. retailers |
Methodology note: the health care and professional services rows are measured outcomes from studies with comparison groups; the banking rows are the bank’s own estimates without a published method; the insurance and PwC rows are survey and statistical findings.15,6,16,17,18 The PwC figure measures revenue per employee in AI-exposed industries, not the effect of adoption.18
Caveat: no sector has a single agreed productivity statistic, which is why manufacturing and retail show adoption and return signals rather than a measured gain.
Adoption sets the ceiling on those gains. The Census Bureau publishes AI use for every sector every two weeks, and the ranking has been stable for a year.
Businesses Using AI by Sector, August 10 to 23, 2026
| Sector | Businesses Using AI in the Past Two Weeks |
|---|---|
| Information | 43.5%21 |
| Professional, scientific, and technical services | 43.3%21 |
| Finance and insurance | 36.5%21 |
| Educational services | 34.8%21 |
| Real estate and rental and leasing | 31.9%21 |
| Health care and social assistance | 24.7%21 |
| Manufacturing | 23.4%21 |
| Wholesale trade | 20.4%21 |
| Retail trade | 15.5%21 |
| Accommodation and food services | 8.5%21 |
| Transportation and warehousing | 7.9%21 |
| All sectors | 23.2%21 |
Methodology note: Census BTOS sector estimates for the survey period with reference weeks August 10 to 23, 2026, published September 10, 2026; the question asks whether the business used AI in any business function in the last two weeks.21
Caveat: BTOS counts every employer business, so sectors dominated by very small firms read low; firms with 250 or more employees reported 38.4% adoption in the same period.21
The natural follow-up question is whether the gains reach the income statement. The first table below lists the share of firms in each industry that report lower costs from AI; the second lists the share that report a return.
Share of Firms Reporting Cost Reduction From AI, by Industry
| Industry | Share Reporting Cost Reduction | Who Was Asked |
|---|---|---|
| Banking | 36%22 | 50 banking leaders, February to March 2026 |
| Manufacturing (firms using AI in the manufacturing function) | 37%23 | Global executives at organizations using AI in manufacturing, May to June 2026 |
| Supply chain (firms using AI in supply chain management) | 41%23 | Global executives at organizations using AI in supply chain management, May to June 2026 |
| All industries | 40%24 | 3,235 senior leaders in 24 countries, August to September 2025 |
Share of Firms Reporting ROI or Revenue Gains From AI, by Industry
| Industry | Share Reporting a Return | What Counts as a Return | Who Was Asked |
|---|---|---|---|
| Financial services | 77%25 | Positive ROI within the first year of generative AI deployment | 556 financial services leaders at organizations with generative AI deployed |
| Banking | 32%22 | Revenue growth from AI | 50 banking leaders |
| Insurance | 47%17 | Revenue uplift within core insurance functions | 100 senior insurance decision-makers |
| All industries | 74%26 | ROI within the first year of generative AI deployment | 3,466 senior leaders at organizations already deploying generative AI |
| All industries | 92%27 | AI investments “already paying for themselves” | 1,900 early-adopter business and IT leaders |
| All industries | 20%24 | Revenue growth achieved from AI | 3,235 senior leaders |
| All industries | 25%28 | AI initiatives that delivered expected ROI | 2,000 CEOs |
Methodology note: the “return” column exists because the surveys define it differently, and the difference explains most of the spread. Vendor surveys that screened for organizations already in production report 74% to 92%; the CEO survey covering all initiatives reports 25%.26,27,28
Caveat: no verified share of manufacturers, health systems, or retailers reporting ROI was found, so those industries are absent rather than estimated.
Workers themselves report time savings that vary by sector. The table below lists the self-reported minutes saved per day in 2024, the most recent year with a sector breakdown.
Self-Reported Time Saved per Worker per Day, by Sector (2024)
| Sector | Minutes Saved per Day |
|---|---|
| Energy and utilities | 7512 |
| Technology | 6612 |
| Manufacturing | 6212 |
| Financial services | 5712 |
| Aerospace and defense | 5212 |
| All sectors | 6012 |
Methodology note: survey of 35,000 workers in 27 countries, October 2024; the 2025 edition of the same survey reports only the global average, which rose to two hours per day.12,13
Caveat: these are perceptions, and the survey publisher itself cautions that perceived savings exceed measured ones.13
What This Means
The data shows that adoption and impact rank the industries differently.
- Finance and insurance sit third on adoption but first on documented savings, because their AI use concentrates in high-volume, rules-based work: service desk tickets, claims, and code.21,16,17
- Health care sits mid-table on adoption but has the cleanest measured result, a 41% cut in after-hours work, because documentation is a single, timeable task.15
- Manufacturing shows the widest gap between activity and return: a third of manufacturing operations are AI-augmented, yet only 37% of firms using AI in that function report any cost decrease.19,23
In Practice
For an engineering leader, the industry row sets a benchmark for a first project, and the rows with the strongest evidence share a trait: the output can be checked. Ambient documentation is timed against after-hours minutes, service desk calls are counted, and translated code can be compared with the behavior of the system it replaces.15,16
Keyhole’s work in these sectors follows the same logic. In healthcare, the Delphi pharmacy migration described above was verified by running the old and new applications side by side, the same checkable-output principle applied to code instead of clinician time. In insurance, a full platform replacement for a Kansas City insurer, covering the UI, services, database, and administrative tooling, was delivered in about five months against an estimate of 18 to 24 months, by 11 people (two Keyhole consultants and nine client engineers) against an estimated 26 or more.58
That is a schedule and staffing result, not a cost saving, so it should not be set beside the EY figure of up to 10% cost savings, which measures something different.17 In financial services, Keyhole’s multi-year work with a regional bank modernized more than 300 batch jobs and simplified reconciliation, a category of work where a job’s output can be compared with the output it replaces.
AI Cost and Time Savings
How much does AI actually save? The first table below shows the share of firms reporting a cost decrease from AI in each business function, split by the size of the decrease. It is the only published cost dataset that separates “any saving” from “a large saving.”
Share of Firms Reporting Cost Decreases From AI, by Function and Size of Decrease (2026)
| Function | Decrease of 10% or Less | Decrease of 11% to 19% | Decrease of 20% or More | Any Decrease |
|---|---|---|---|---|
| Supply chain management | 28% | 10% | 3% | 41%23 |
| Service operations | 25% | 6% | 7% | 38%23 |
| Manufacturing | 28% | 8% | 1% | 37%23 |
| Marketing and sales | 23% | 9% | 2% | 34%23 |
| Human resources | 20% | 7% | 6% | 33%23 |
| Software engineering | 20% | 9% | 4% | 33%23 |
| Strategy and corporate finance | 15% | 10% | 6% | 31%23 |
| Product or service development | 18% | 8% | 5% | 31%23 |
| IT | 18% | 7% | 3% | 28%23 |
| Risk | 16% | 8% | 4% | 28%23 |
| Knowledge management | 12% | 6% | 7% | 25%23 |
Methodology note: percent of 1,719 respondents whose organizations regularly use AI in the function, surveyed May 4 to June 8, 2026; respondents who reported a cost increase, no change, or did not know are not shown, and figures may not sum to totals because of rounding.23 The 2026 survey measured impact at the business-function level rather than rolling up individual use cases, so these shares are not comparable with the 2025 edition, in which 56% of software engineering respondents reported a decrease.23,29
Caveat: in every function, the largest group reports a decrease of 10% or less; decreases of 20% or more are reported by 1% (manufacturing) to 7% (service operations, knowledge management) of respondents.23
On the time side, the cleanest comparable measure is the share of work hours saved. The table below lists it for the three populations where it has been measured or surveyed.
Share of Work Hours Saved by Generative AI, by Population
| Population | Share of Work Hours Saved | How It Was Measured |
|---|---|---|
| U.S. workers who use generative AI (users only) | 5.4%10 | Self-reported, nationally representative survey, November 2024 |
| All U.S. workers (users and non-users) | 2.2%11 | Self-reported, nationally representative survey, Q2 2026 |
| Danish workers in 11 AI-exposed occupations | 2.8% (0.6% for teachers without employer encouragement to 6.8% for marketing professionals with it)30 | Survey of about 25,000 workers linked to administrative payroll records, 2023 to 2024 |
Methodology note: the Danish study is the only one that linked reported savings to payroll and hours records; it found earnings and hours effects that were “precise zeros” through mid-2024 despite the reported time saving.30
Caveat: per-day self-reports run higher than these shares. Enterprise ChatGPT users report 40 to 60 minutes saved per active day, and 60 to 80 minutes in data science, engineering, and communications roles; a global survey of 37,500 workers reports two hours per day.31,13 A model-based estimate of Claude conversations put the median time saving per task at 84%, on tasks that would take about 1.4 hours without AI, which the authors describe as an upper bound.32
Which tasks produce the savings? The Census Bureau’s 2026 AI supplement asked businesses whose employees use generative AI which tasks they use it for.
Share of AI-Using Businesses Whose Employees Use Generative AI, by Task Type
| Task Type | Share of AI-Using Businesses |
|---|---|
| Writing or editing documents, emails, or communications | 85.4%33 |
| Searching for information or technical help | 49.9%33 |
| Interpreting, analyzing, translating, or summarizing documents | 44.6%33 |
| Information processing, paperwork, or filing | 34.7%33 |
| Developing or researching new projects, processes, or products | 30.0%33 |
| Data analysis or visualization | 19.1%33 |
| Tutoring, training, or learning | 16.1%33 |
| Customer support | 15.5%33 |
| Software coding or debugging | 12.7%33 |
Methodology note: shares are among businesses that answered yes to employees using generative AI for work tasks in the prior six months (20.8% of all U.S. employer businesses), collected November 17, 2025 to February 8, 2026; respondents could select multiple tasks.33
Caveat: the list is weighted toward office work; the task with the smallest estimated time saving in model-based data, checking diagnostic images at about 20%, is not on it.32
The follow-up question is how much time each task type saves. The table below lists model-based estimates of the time saved per task, the only task-level dataset published in a single unit.
Estimated Time Saved per Task, by Task Type (Model-Based Estimate)
| Task Type | Estimated Time Saved per Task |
|---|---|
| Curriculum development | About 95%32 |
| Document writing (invoices, memos) | About 87%32 |
| Financial analysis interpretation | About 80%32 |
| All tasks (median conversation) | 84%32 |
| Checking diagnostic images | About 20%32 |
Methodology note: estimates come from Claude.ai conversations in which the model judged how long each task would take with and without AI; the publisher describes them as an upper bound, and software developers account for 19% of the aggregate estimated gain.32
Caveat: these are estimates, not measurements. The measured equivalents in Section 1 (40% less time on writing, 14% more customer issues resolved per hour) are far smaller.5,1
The last follow-up question in this section is how much routine work is automated outright rather than assisted. The Census AI supplement asked that question directly.
How AI-Using Businesses Applied AI to Employee Tasks, November 2025 to February 2026
| Use of AI | Share of AI-Using Businesses |
|---|---|
| Supplemented or enhanced a task performed by an employee | 43.7%33 |
| Introduced a new task not previously done by an employee | 10.6%33 |
| Performed a task previously done by an employee | 10.1%33 |
| None of the above | 51.5%33 |
Methodology note: shares are among businesses using AI (about one in five U.S. employer businesses), and respondents could select more than one answer.33 Among the 10.1% that replaced an employee task, 70.9% said it was a small number of tasks, 22.0% a moderate number, and 7.1% a large number; 95.7% of AI-using businesses reported no change in total employment.33 A Census working paper on the same data found 66% of AI users rely on AI solely to augment tasks.34
Caveat: estimates of automatable work run far ahead of these figures. Employers surveyed by the World Economic Forum said 22% of work tasks were performed mainly by technology in 2025 and expected 34% by 2030, and a 2023 estimate put 60% to 70% of employee time on activities that current AI could technically automate.35,36 On Claude.ai, 45% of conversations followed automation patterns and 52% augmentation in November 2025; 77% of business API use followed automation patterns in August 2025.37,38
What This Means
The automation rate of routine work is far lower than the automatable share.
- One in ten AI-using businesses has moved a task from a person to AI, and seven in ten of those describe it as a small number of tasks; 95.7% report no employment change.33
- Most of the time saved today comes from assistance on writing, search, and summarizing, the three tasks used by 45% to 85% of AI-using businesses.33
- The cost side matches: in every business function, the largest group of firms reporting a cost decrease puts it at 10% or less.23
In Practice
Hours saved and costs saved are different projects. A team that reclaims two hours a week per person has created capacity, not savings, and 72% of sales organizations report low reinvestment of that time.8 In our experience the savings that survive an audit come from workflows that were redesigned around the tool, which is also where the high performers are: nearly three-quarters of them report fundamentally redesigning workflows, up from 55% a year earlier.23
Two Keyhole projects show what that looks like at a realistic scale. On a COBOL-to-Spring-Batch conversion for a wholesale food distribution cooperative, AI-assisted translation reduced manual effort by 20 to 30%.59,14 That is a project-reported effort figure, not a cost decrease, and it sits well below the 55.8% task-level result from the controlled Copilot study,3 which is closer to what we expect on production work. On the Delphi migration, the team left behind assets that outlast the project: a documented, testable .NET application and a reusable serialization component.57 Capacity becomes savings when it is captured in something that persists, and documentation, tests, and shared components are the usual forms.
AI Adoption vs. Realized Impact
Nearly nine in ten large organizations use AI somewhere, and about one in five U.S. businesses of any size does.23,21 The share that can point to a measurable gain is much smaller. The table below places adoption and realized impact side by side from each major survey; because each survey defines “measurable gain” differently, the definition is stated in the row.
Share of Companies Adopting AI vs. Share Seeing Measurable Gains
| Survey Population | Adopting AI | Seeing Measurable Gains (as Defined by the Survey) |
|---|---|---|
| 1,719 executives, global, May to June 202623 | Nearly 9 in 10 use AI in at least one function; 44% scaling across the enterprise | 37% attribute any EBIT impact to AI; 6% attribute 5% or more of EBIT |
| 4,454 CEOs, 95 countries, late 202539 | Not asked as adoption | 30% report increased revenue from AI in the past 12 months; 26% lower costs; 12% both; 56% neither |
| 2,000 CEOs, 33 countries, early 202528 | 61% actively adopting AI agents | 25% of AI initiatives delivered expected ROI; 16% scaled enterprise-wide |
| 197 executives, Q3 202540 | 59% meaningfully adopting generative AI | 23% say generative AI delivered more revenue or lower costs |
| 3,235 senior leaders, 24 countries, late 202524 | 34% transforming deeply; 37% using AI at a surface level | 66% report productivity gains; 40% cost reduction; 20% revenue growth |
| 1,250 senior executives, 68 countries, 202541 | 35% scaling; 46% emerging; 14% stagnating | 5% achieve substantial value; 60% report minimal revenue and cost gains |
| 313 Texas executives, May 202642 | 66.7% currently using AI (services 69.2%, manufacturing 56.8%) | 71.4% of AI-using firms report higher productivity for AI-using employees |
| 23,717 employed U.S. adults, February 202643 | 50% use AI at work at least a few times a year; 13% daily | 65% in adopting organizations say AI improved their productivity; 8% strongly agree it transformed how work gets done |
| All U.S. employer businesses, Census BTOS, 202621,33 | 23.2% used AI in the past two weeks; 38.4% of firms with 250 or more employees | 10.1% of AI users replaced an employee task; 95.7% report no employment change |
Methodology note: “measurable gain” is EBIT attribution in the McKinsey survey, revenue or cost change in the past 12 months in the PwC and Bain surveys, expected ROI in the IBM survey, and self-assessed value in the BCG survey; none are audited figures.23,39,40,28,41
Caveat: the surveys disagree on the size of the gap because they sample differently. Surveys of firms already in production report 74% to 92% ROI rates; CEO surveys of all initiatives report 12% to 25%.26,27,39,28
Adoption itself is still rising quickly. The table below lists the share of businesses using AI in each survey that has published two comparable years.
Share of Businesses Using AI, Year Over Year
| Population | Earlier Reading | Latest Reading | Change |
|---|---|---|---|
| All U.S. employer businesses, past two weeks21 | 17.3% (Nov. 3 to 16, 2025) | 23.2% (Aug. 10 to 23, 2026) | +5.9 pts |
| Large organizations globally, regular use in at least one function44,29 | 78% (2024) | 88% (2025) | +10 pts |
| Service firms, New York and northern New Jersey45 | 40% (Aug. 2025) | 61% (Aug. 2026) | +21 pts |
| Manufacturers, New York and northern New Jersey45 | 26% (Aug. 2025) | 51% (Aug. 2026) | +25 pts |
| Texas firms, all industries42 | 59% (May 2025) | 66.7% (May 2026) | +7.7 pts |
Methodology note: the rows use different definitions of “using AI,” which is why the levels differ so much. Census counts any use in the past two weeks across every employer business, including firms with fewer than five employees; the McKinsey survey covers larger organizations and asks about regular use; the Fed surveys ask whether the firm currently uses AI.21,29,45,42
Caveat: the Fed surveys are regional and the Texas manufacturing sample is small (74 firms), so their year-over-year changes carry more sampling error than the Census series.42
Why do so many adopters fail to realize gains? The table below ranks the challenges named by 1,250 senior executives in the largest single survey on the question.
Barriers to Realizing AI Gains, Share of Executives Citing Each (2025)
| Barrier | Share Citing It |
|---|---|
| No expertise to manage unstructured data | 79%41 |
| People adapting to changes and using AI daily | 77%41 |
| Shortage of AI talent | 74%41 |
| AI-driven security risks | 72%41 |
| Integrating AI with systems, tools, and APIs | 72%41 |
| Silos limiting cross-functional collaboration on AI | 69%41 |
| Lack of access to high-quality data | 68%41 |
| Missing clear AI metrics and ROI measurement | 68%41 |
| Potential hallucinations and lack of explainability | 67%41 |
| Insufficient model accuracy and reliability | 66%41 |
| Compliance and implementing responsible AI | 66%41 |
| High AI scaling costs that are difficult to control | 63%41 |
| Difficulty aligning AI initiatives with firmwide strategy | 63%41 |
| Social resistance and labor concerns limiting scale | 52%41 |
| Lack of leadership support or commitment for AI | 42%41 |
Methodology note: respondents could select multiple challenges, so shares sum to more than 100%; the survey covered 1,250 C-suite and senior executives in 68 countries and nine industries in 2025.41 Other 2026 surveys point the same way: 71% of 4,500 respondents struggle with data accuracy, access, and management; 60% of more than 1,100 B2B executives cite an inadequate data foundation or technology readiness; 58% of 204 U.S. executives at $1 billion-plus companies name data readiness as the top challenge for AI agents, and only 26% of them have full real-time visibility into what their AI systems cost to run; one in five executives says their organization is limiting AI use because of operating costs.46,47,48,23
Caveat: these surveys sample large companies, where data and integration dominate. For most U.S. businesses the barrier is relevance: among businesses not planning to use AI, 61.6% say AI is not applicable to the business, 22.0% cite lack of knowledge of AI capabilities, 20.7% cite privacy or security concerns, 13.0% say AI is not mature enough, 7.1% cite a lack of skilled workers, and 6.9% say it is too expensive.33
The final question is timing. The table below lists the share of organizations reporting a return at each time horizon that a survey has asked about.
Share of Organizations Reporting ROI From AI, by Time Horizon
| Time Horizon | Share Reporting a Return | Who Was Asked |
|---|---|---|
| ROI within the first year of generative AI deployment | 74%26 | 3,466 senior leaders at organizations already deploying generative AI, 2025 |
| ROI within the first year, financial services | 77%25 | 556 financial services leaders at organizations with generative AI deployed, 2025 |
| Investments already paying for themselves | 92%27 | 1,900 early-adopter business and IT leaders, 2025 |
| Already seeing positive ROI from generative AI | Nearly three-quarters49 | About 800 senior leaders at large U.S. firms, mid-2025 |
| Expect positive returns within two to three years | 4 in 549 | Same 800 senior leaders |
| Most advanced initiative meeting or exceeding ROI expectations | 74%50 | Senior leaders surveyed July to September 2024 |
| Payback period under one year | 6%51 | 1,854 senior executives in Europe and the Middle East, 2025 |
Methodology note: “ROI” is a respondent judgment in every row, not a calculated return, and the two vendor surveys screened for organizations with generative AI already in production.26,27 The European and Middle Eastern survey found most organizations reach satisfactory ROI in two to four years; the survey of 1,250 executives found the most AI-mature companies reach impact in 9 to 12 months against 12 to 18 months for others.51,41
Caveat: many projects never reach the horizon. The share of companies that discontinued most of their AI initiatives between proof of concept and production rose from 17% in Q4 2023 to 42% in Q4 2024, with an estimated 46% of projects ended at that stage; analyst forecasts put generative AI project abandonment after proof of concept at 30% or more by the end of 2025 and agentic AI project cancellations at more than 40% by the end of 2027.52,53,54 Among CEOs, 56% report no significant financial benefit from AI to date.39
What This Means
The data shows a clear divide between organizations that measure and organizations that hope. Among executives whose companies formally track generative AI ROI, 72% of the Wharton sample, most report a return within one to three years.49 Among all CEOs, 56% see no financial benefit yet, and a quarter of initiatives meet expectations.39,28
The barriers table explains the difference: data access, integration with existing systems, and the absence of ROI metrics are named by two-thirds or more of executives, and only 26% of large companies can see what their AI systems cost to run in real time.41,48 This analysis revealed that the ROI timeline is driven less by the model than by the data and integration work that precedes it.
In Practice
For a CIO, the pilot is rarely where the risk sits. An estimated 46% of AI projects are stopped between proof of concept and production, and the barriers executives name most often, unstructured data, integration with existing systems, and missing ROI metrics, are engineering problems that a demo can hide.52,41
Keyhole’s project work follows that pattern. On an enterprise RAG proof of concept for a B2B information company, the initial database deployment proved insufficient as XML content volume grew, so the team moved to managed Postgres on Google Cloud and built retrieval boundaries, metadata filtering, and audit logging into the architecture.60 On a document intelligence platform for a regulated enterprise, the core of the work was an ingestion pipeline and grounding each response in the customer’s own documents, which targets two barriers near the top of the BCG list: unstructured data (79%) and hallucination risk (67%).61,41
In both projects, senior engineering time went to data readiness and control layers, not model selection. Strong teams get faster with AI and weak teams become less predictable, which is why we treat test gates and governance as prerequisites rather than add-ons.62
Implications for Engineering Leaders
Four findings hold across every table.
- First, measured AI productivity gains by function are real and large per task, from 14% in customer service to 26% in software development and 40% in professional writing, but they apply to the 6.3% of work hours that AI currently touches, which is why the economy-wide saving is 2.2% of hours and the firm-level gain is 1.8%.1,2,5,11,7
- Second, the industries with the most documented savings, finance, insurance, and health care, are not the industries with the highest adoption; they are the ones that pointed AI at repetitive, checkable work.21,16,15
- Third, most reported cost decreases are 10% or less, and only one in ten AI-using businesses has automated a task outright.23,33
- Fourth, the gap between the nine in ten organizations using AI and the roughly four in ten seeing any EBIT effect is explained by data, integration, and measurement barriers, not by the models.23,41
The decision consequence is direct. A leader who benchmarks against the vendor ROI surveys will expect first-year returns; a leader who benchmarks against the CEO surveys will expect a quarter of initiatives to pay off. The realistic target sits between them and depends on how much integration and testing work is done before the first production deployment.
Across every table above, the results that hold up share one trait: someone can check them against something that already exists, whether a control group, the behavior of a legacy system, or a reconciled ledger. That is the standard Keyhole applies to AI-accelerated modernization. Our 100% U.S.-based senior consultants average more than 17 years of experience and more than five years with the firm, and they use agentic tools including Claude and Codex inside architect-governed, test-gated workflows so the behavior of the system being replaced is preserved.55,14 Keyhole is a member of the Claude Partner Network, and roughly 78% of our annual work comes from repeat clients.56
For teams planning a first AI-accelerated project, our Agentic AI Delivery in Practice article walks through how those workflows are set up.
References
14. Keyhole Software, “Enterprise AI Development in the Anthropic Ecosystem”
18. PwC, “2026 Global AI Jobs Barometer,” press release, June 15, 2026
32. Anthropic, “Estimating AI Productivity Gains from Claude Conversations,” November 25, 2025
37. Anthropic, “Anthropic Economic Index: Economic Primitives,” January 15, 2026
55. Keyhole Software, Services
56. Keyhole Software, Clients and Partners
57. Keyhole Software, “Delphi to .NET Modernization Case Study: Delivering a Five-Month Migration in Three Months”
58. Keyhole Software, “AI-Accelerated Development in Practice: A Repeat Client Modernization Story”
59. Keyhole Software, “AI-Accelerated COBOL Modernization to Spring Batch”
60. Keyhole Software, “Enterprise Generative AI Proof of Concept Using RAG Architecture”
61. Keyhole Software, “AI-Powered Document Intelligence & Regulatory Compliance Platform”
62. Keyhole Software, “Enterprise AI-Assisted Development: How Teams Get Repeatable Results“
More From Keyhole Software
About Keyhole Software
Expert team of software developer consultants solving complex software challenges for U.S. clients.
Share This Post
Join The Thousands Of Devs Who Subscribe

Discuss This Article
Subscribe
Login
0 Comments
Oldest