
Digital Transformation Statistics 2026: Market Size, Industry Adoption, ROI, and the Agentic AI Acceleration Angle
Digital transformation moved from boardroom strategy into operating reality in 2026. Across leading research firms, the global digital transformation market is valued between $1.1 trillion and $2.6 trillion in 2025 depending on methodology, with most forecasts pointing to roughly 19% to 21% compound annual growth through 2030.123
Behind the headline figures, the composition of digital transformation spending is shifting. Service segments are growing faster than solution segments, agentic AI is moving from experiment to production, and legacy modernization is positioning itself as the enabling layer between existing systems and cloud and AI architectures.
The economics tell a more complicated story. McKinsey’s most recent State of AI survey, fielded June to July 2025 across 1,993 respondents, found that nearly nine out of ten organizations now use AI regularly in at least one business function.6 Yet only 5.5% of those organizations report greater than 5% EBIT impact attributable to AI, and just 39% report any EBIT impact at all (most of it under 5%).6 The transformation programs that succeed in 2026 are not the ones that adopt the most tools. They are the ones that pair acceleration with governance, architecture, and validation.
From December 2025 through May 2026, our research team compiled digital transformation statistics from leading global research firms, industry surveys, and enterprise analyst publications. We analyzed data from sources including McKinsey, Gartner, Deloitte, Grand View Research, Fortune Business Insights, The Business Research Company, MarketsandMarkets, Mordor Intelligence, Microsoft, IDC, the IBM Cost of a Data Breach Report, and additional industry research. The result is a current view of where the market stands and where transformation programs are actually delivering value.
Digital Transformation Trends Covered in This Report
- Global digital transformation market size and growth projections
- Industry adoption rates across financial services, healthcare, manufacturing, retail, and government
- Technology investment breakdown across cloud, AI, data platforms, IoT, and modernization
- ROI and business impact metrics across program types
- Enterprise versus mid-market and SMB adoption patterns
- Agentic AI as an acceleration layer for transformation programs
All market valuations, growth rates, and adoption metrics cited in this report are sourced from named, verifiable third-party research organizations. Where multiple firms track the same segment using different methodologies, we present the range of estimates and note the definitional differences.
How Keyhole Software Uses These Statistics
Keyhole Software tracks these market dynamics as part of our ongoing work in digital transformation, legacy modernization, and AI-accelerated delivery. As a U.S.-based custom software and consulting firm with senior consultants averaging 17+ years of experience, we apply these statistics in real planning work with CTOs and engineering leaders, using them to evaluate transformation roadmaps, prioritize modernization investments, structure AI governance frameworks, and benchmark program timelines against industry norms.
The statistics in this report are not theoretical. They reflect the conditions we encounter in active engagements across financial services, healthcare, insurance, manufacturing, and retail. Where the data points to a market trend, we explain how that trend shows up in real transformation programs and what enterprise teams should consider when planning their next step.
The Global Digital Transformation Market in 2026: Size and Growth
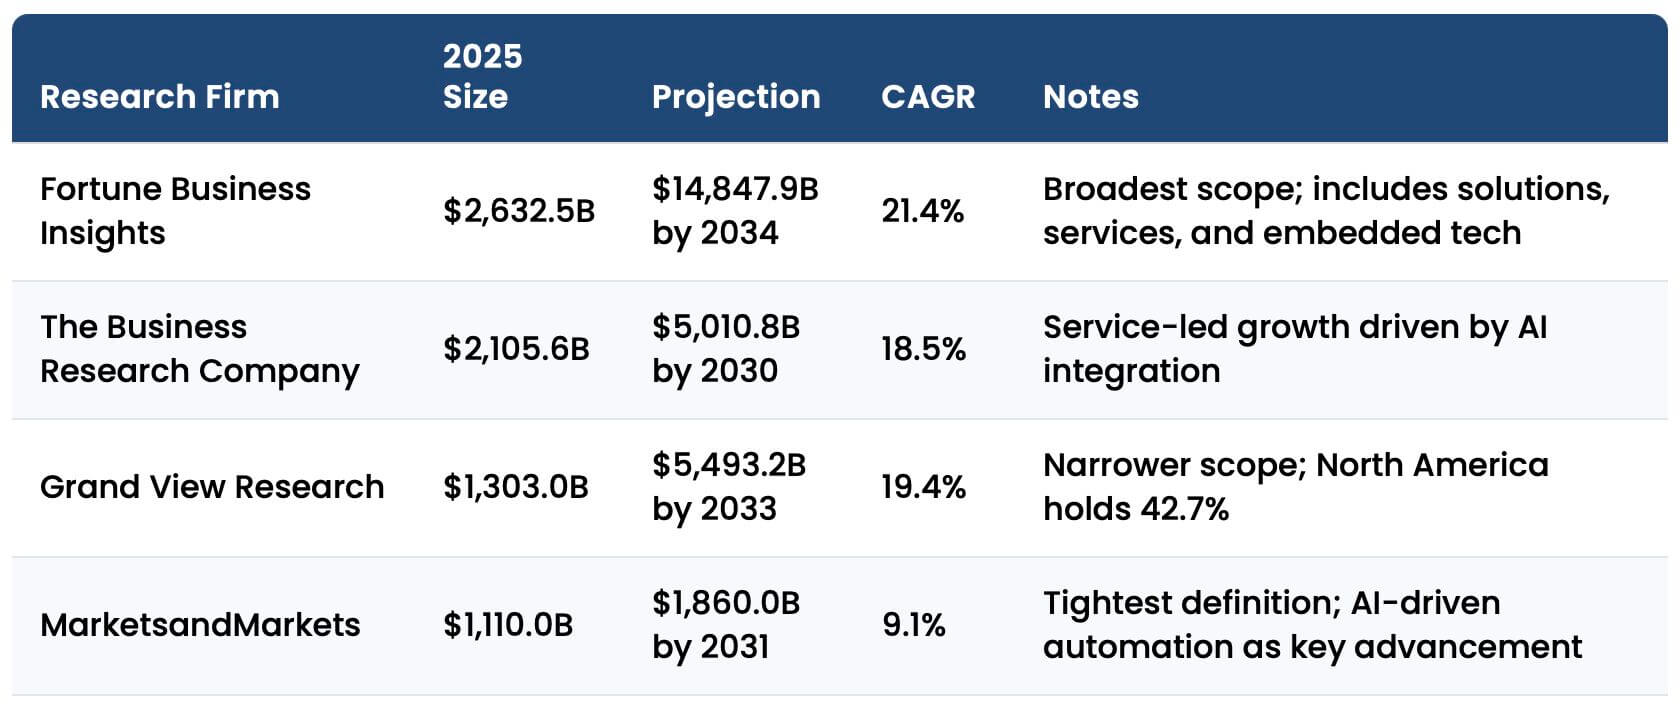
Digital transformation is one of the most fragmented categories in technology research. Leading firms publish market sizes that differ by an order of magnitude depending on which technologies, services, and use cases they include in the definition. The table below presents 2026 estimates from five research firms, each using a different methodology.
| Research Firm | 2025 Size | Projection | CAGR | Notes |
|---|---|---|---|---|
| Fortune Business Insights | $2,632.5B | $14,847.9B by 2034 | 21.4% | Broadest scope; includes solutions, services, and embedded tech |
| The Business Research Company | $2,105.6B | $5,010.8B by 2030 | 18.5% | Service-led growth driven by AI integration |
| Grand View Research | $1,303.0B | $5,493.2B by 2033 | 19.4% | Narrower scope; North America holds 42.7% |
| MarketsandMarkets | $1,110.0B | $1,860.0B by 2031 | 9.1% | Tightest definition; AI-driven automation as key advancement |
| Mordor Intelligence (US only) | $660.0B | $1,960.0B by 2031 | 19.85% | US-only segmentation; 78% of US firms embed generative AI |
Sources: Fortune Business Insights1, The Business Research Company2, Grand View Research3, MarketsandMarkets4, Mordor Intelligence (US-only segment)5
What this means: Despite different definitions and totals, every major research firm points to sustained, accelerating growth. The convergence on roughly 19% to 21% CAGR across most forecasts indicates broad agreement that digital transformation is no longer cyclical IT spending. It is a structural reorientation of how enterprises operate.
Key Findings
- The global digital transformation market is estimated at $1.1 trillion to $2.6 trillion in 2025, with most leading research firms projecting roughly 19% to 21% CAGR through 2030 and beyond.
- North America commands 39.8% to 42.7% of the global market across the major research firms13, driven by enterprise software spend, AI integration, and large-scale modernization programs.
- Service segments are growing faster than solution segments across multiple research firms, reflecting demand for consulting, integration, and managed services as organizations modernize complex environments.
- Within the US specifically, 78% of firms now embed generative AI, producing a documented $3.70 return per $1 invested per Microsoft and IDC research from Microsoft Ignite 2024.57
In Practice
In enterprise transformation programs, the market-size dispersion reflects something we see directly in client engagements: digital transformation is not one initiative. It is a portfolio of overlapping programs that touch cloud migration, application modernization, data platform consolidation, AI integration, and customer experience redesign. The organizations that move fastest tend to treat these as one coordinated program, not as separate projects competing for budget.
Where the data shows accelerating service-segment growth, we see the practical reason in our work: organizations are no longer underestimating the consulting and integration effort required to make these programs land. Modern transformation is rarely about implementing a single platform. It is about sequencing modernization, cloud, data, and AI work so each phase enables the next. That sequencing is where senior architectural oversight changes outcomes most.
Strategic takeaway: Organizations that treat digital transformation as a sequenced portfolio of programs rather than a single initiative are more likely to capture compounding ROI. The market data validates this. Service-led delivery is growing faster than packaged solutions because enterprises now recognize that transformation outcomes are determined by integration and governance, not by technology selection alone.
Industry Adoption Rates and Sector-Specific Patterns
Digital-first adoption varies dramatically by industry based on regulatory pressure, competitive intensity, and the operational cost of system failure. The table below summarizes adoption rates and the primary investment areas in each major sector.
| Industry | Digital-First Adoption | Primary Investment Focus | Key Indicator |
|---|---|---|---|
| Financial Services | 93% | Core banking, AI fraud detection, open banking APIs | 75% of banks actively transforming; roughly 30% report full success |
| Healthcare | 92% | EHR modernization, telehealth, AI diagnostics | 124% average ROI on successful programs; $7.42M average breach cost |
| Professional Services | 95% | Workflow automation, data platforms, client experience | Highest digital-first adoption rate across sectors |
| Manufacturing | Mid-tier | Industry 4.0, IoT, predictive maintenance, smart manufacturing | 92% see smart manufacturing as primary competitive driver; 74% still on disconnected systems |
| Retail and E-commerce | Mid-tier | Personalization, dynamic pricing, omnichannel platforms | 70% cite competitiveness as primary driver; 76% find implementation challenging |
| Government and Public Sector | Lagging | Citizen services, legacy retirement, cybersecurity | Among five most behind sectors; constrained by budget and procurement cycles |
Sources: Market.us8, Integrate.io / Fortune Business Insights9, Deloitte 2025 Smart Manufacturing Survey10, IBM Cost of a Data Breach Report 202511, Whatfix12
What this means: Digital transformation is not evenly distributed. Sectors with higher regulatory pressure, security risk, or operational dependency on legacy systems tend to prioritize transformation earlier and invest more aggressively. Sectors constrained by budget cycles or public funding lag, even when transformation would generate measurable returns.
Key Findings
- Financial services leads with 93% digital-first adoption8, with 75% of banks actively transforming, though roughly 30% report full transformation success.
- Healthcare delivers the highest documented ROI on successful transformations at 124% average per Integrate.io research9, but the failure rate remains elevated, and average breach costs of $7.42 million per IBM11 are accelerating modernization urgency.
- Manufacturing is universally aligned on the importance of Industry 4.0. Deloitte’s 2025 Smart Manufacturing Survey of 600 senior executives at companies with $500M+ revenue found 92% identifying smart manufacturing as the primary driver of competitiveness over the next three years.10 Yet 74% of manufacturers still operate on disconnected legacy systems, constraining IoT and predictive maintenance deployment.
- Government, healthcare, hospitality, construction, and agriculture are the five sectors most behind on digital transformation per Whatfix research12, with public funding cycles, regulatory complexity, and older workforces as common constraints.
In Practice
In financial services engagements, we see the practical reality behind the 93% adoption number: most banks have started transformation programs, but transformation success is concentrated in the institutions with the budget and architectural maturity to execute multi-year programs. The 30% full-success rate is consistent with what we observe in client work, where the difference between success and stall is usually not technical capability but program governance, data readiness, and the ability to fund a multi-phase roadmap.
In healthcare, the urgency profile is different. Average breach costs of $7.42 million per IBM’s 2025 Cost of a Data Breach Report11, combined with the fact that legacy systems unable to receive security patches extend breach detection timelines, shift transformation from strategic initiative to operational necessity. Healthcare clients increasingly approach modernization as a risk-mitigation program first and a capability-expansion program second.
In manufacturing, the 74% still operating on disconnected legacy systems creates a downstream constraint that limits IoT, predictive maintenance, and edge computing adoption. This is the practical reason Industry 4.0 has progressed unevenly across the sector. Foundational modernization is the prerequisite. In our work with manufacturing clients, the most productive engagements start with API-led modernization of legacy core systems, then layer IoT and analytics on top. Trying to layer modern capabilities on top of unmodernized cores creates integration debt that grows faster than the capabilities deliver value. Keyhole has supported clients including AMC Theatres on multi-year digital commerce platform modernization spanning API modernization, cloud migration, and ongoing performance improvements across high-volume customer-facing services.
Strategic takeaway: Industry-level adoption rates mask significant within-sector variation. The organizations capturing transformation ROI in any sector are the ones that align program governance, data readiness, and architectural sequencing to their specific risk profile and competitive context. The right transformation strategy is rarely identical to the sector average.
Technology Investment Breakdown
Digital transformation spending flows across overlapping technology categories. The table below maps the major categories and their relative scale in 2026, alongside the role each plays in enterprise transformation programs.
| Technology Category | 2026 Market Size | Adoption Signal | Role in Transformation |
|---|---|---|---|
| Cloud Computing | ~$912.8B | 89% multi-cloud adoption | Default destination for modernized workloads |
| Artificial Intelligence | ~$390.9B | 88% of orgs use AI in at least one function | Acceleration layer for modernization and automation |
| Agentic AI | ~$11.0B | 40% of enterprise apps to embed task-specific AI agents by end of 2026 | Autonomous workflow execution within governed environments |
| Data Platforms and Analytics | Embedded across categories | 72% cite data quality as top barrier | Foundation layer; transformation stalls without it |
| IoT and Edge Computing | 75B+ devices by 2025 | 52% of enterprises investing in IoT; 44% adopting edge | Critical in manufacturing, logistics, healthcare |
| Legacy Modernization | $25-30B | 14.9-17.6% CAGR | Enabling layer between existing systems and cloud/AI architectures |
Sources: Precedence Research (Cloud)13, Grand View Research (AI)14, Gartner / ServiceNow (Agentic AI)15, Deloitte (Data)16, Flexera (Cloud)17, Mordor Intelligence (Modernization)5
What this means: Technology investment in transformation programs is no longer dominated by any single category. The fastest-growing segments (AI, agentic AI, modernization, data platforms) are interdependent. Cloud is the destination for most modernized workloads. AI is increasingly the mechanism that accelerates modernization and powers new application logic. Data platforms are the prerequisite that determines whether AI initiatives produce measurable returns.
Key Findings
- Cloud computing has crossed the threshold from optional infrastructure to default destination, with 89% multi-cloud adoption per Flexera17 and over 67% of modernization revenue attributed to cloud-based delivery.
- AI is widely deployed but the impact gap is significant. McKinsey’s 2025 State of AI survey found nearly 90% of organizations regularly use AI in at least one function6, yet only 5.5% report greater than 5% EBIT impact from AI initiatives.
- Data quality is the top barrier to AI value, with 72% of private company leaders per Deloitte16 citing data quality and availability as their primary challenge in scaling transformation programs.
- Agentic AI is moving from pilot to production rapidly. Gartner forecasts 40% of enterprise applications will embed task-specific AI agents by the end of 2026, up from less than 5% in 2024.15
In Practice
The interdependency across these technology categories is the single most important pattern we see in real transformation programs. Organizations that invest in AI without addressing data quality stall. Organizations that modernize legacy systems without a clear cloud destination produce expensive intermediate states. Organizations that adopt agentic AI without architectural governance generate output that engineers cannot trust enough to deploy.
The sequence that produces compounding returns, based on patterns we see in client engagements, typically follows: data foundation first, then cloud destination, then modernization of business-critical legacy systems, then AI as the acceleration layer across all of it. Organizations that try to start with AI and work backward typically discover the foundational gaps too late. Our work in AI-accelerated development and RAG architecture reflects this layered approach: AI applied where the foundation is ready, governed by senior architectural oversight.
Strategic takeaway: The categories on this list are not independent budget lines. Treating them as one coordinated investment program produces materially better outcomes than funding them as parallel initiatives. The McKinsey EBIT impact gap, where 5.5% of organizations capture meaningful enterprise-level value from AI while the rest deploy without measurable impact, is concentrated among organizations that deployed AI before addressing data, cloud, or modernization foundations.
ROI and Business Impact Benchmarks
Digital transformation ROI varies widely by sector, program design, and organizational scale. The table below summarizes documented impact metrics from leading sources, alongside the caveats that explain when these returns actually materialize.
| ROI / Impact Metric | Reported Value | Driver | Caveat |
|---|---|---|---|
| Healthcare DX ROI (successful programs) | 124% average | Operational efficiency, improved outcomes | Applies only to programs that fully execute; failure rates remain elevated |
| Financial Services DX ROI (average) | 30% average | Process automation, fraud reduction | Heavily concentrated in larger institutions |
| Generative AI ROI Multiple (Microsoft + IDC) | $3.70 per $1 invested | Workforce productivity, customer experience | Reported across Microsoft AI enterprise deployments |
| Revenue Impact (well-executed DX) | 5-15% | New product velocity, customer retention | Value capture typically begins year two |
| Cost Reduction (well-executed DX) | 10-25% | Process automation, infrastructure consolidation | Programs typically run 3-5 years before full capture |
| Organizations Reporting >5% EBIT Impact from AI | 5.5% (McKinsey) | Sustained operating discipline, workflow redesign | 39% report any EBIT impact; most under 5% |
Sources: Integrate.io9, Microsoft + IDC7, Deloitte16, McKinsey State of AI 20256
What this means: Reported transformation ROI is real, but it is heavily concentrated among programs that fully execute. Failure rates remain elevated. The organizations capturing the top of the range share common characteristics: clear executive sponsorship, multi-year funding stability, senior engineering oversight, and data readiness established before AI initiatives launch.
Key Findings
- Healthcare delivers the highest documented ROI at 124% average on successful transformations per Integrate.io9, but the failure rate remains elevated and the 124% figure applies only to programs that fully execute.
- Microsoft and IDC research released at Microsoft Ignite 2024 documented a $3.70 return per $1 invested in generative AI across Fortune 500 enterprise deployments, alongside reported enterprise AI adoption climbing from 55% (2023) to 75% (2024).7
- 70% of digital transformation projects exceed their original timelines by an average of 45%, with complexity underestimation and data readiness gaps as the most common causes per Integrate.io aggregated research.9
- Large enterprises ($500M+ revenue) report 64% ROI on transformation programs versus 11% for smaller organizations per Deloitte16, reflecting how scale enables faster compounding of returns.
- McKinsey’s 2025 State of AI survey found only 5.5% of organizations (109 of 1,993 respondents) report greater than 5% EBIT impact from AI.6 This 5.5% cohort is closely studied as the “AI high performers,” distinguished by sustained workflow redesign, senior governance, and multi-year operating discipline.
In Practice
The 70% timeline-overrun statistic is consistent with patterns we see across client engagements. The most common root causes are not technical: they are program-level. Data quality assumptions that do not hold up under integration testing. Business-logic ambiguity that does not surface until late-phase validation. Stakeholder priorities that shift as programs extend across budget cycles. The organizations that finish on time are the ones that build slack into early phases specifically to discover these issues before downstream commitments are locked.
The gap between 64% enterprise ROI and 11% for smaller organizations reflects something concrete in our work: enterprises can absorb the upfront cost of architectural validation, data foundation work, and senior engineering oversight that produces compounding returns. Smaller organizations are often forced to skip those phases for budget reasons, which creates the conditions for the timeline overruns and partial outcomes that depress their ROI numbers. The most effective mid-market transformation programs we have supported find ways to capture enterprise-grade architectural rigor without enterprise-scale headcount, typically by engaging senior external consultants for the architecture and governance layers while internal teams execute.
Strategic takeaway: Headline ROI figures are achievable but they are not the realistic baseline for most programs. The realistic baseline includes a meaningful probability of timeline overrun, partial scope delivery, or value capture that lags initial projections by 12 to 24 months. Building those probabilities into program plans, and investing early in the architectural and data foundations that determine whether ROI materializes, is what separates the McKinsey AI high-performer cohort from the 94.5% of organizations that deploy AI without enterprise-level financial impact.
Enterprise versus Mid-Market and SMB Transformation Patterns
Digital transformation is no longer the exclusive territory of large enterprises, but the patterns of adoption, ROI, and constraint look fundamentally different across organization size. The table below compares enterprise and mid-market and SMB patterns across the dimensions that matter most for program planning.
| Dimension | Large Enterprise (500+ employees) | Mid-Market and SMB | Implication |
|---|---|---|---|
| Share of DX Market | 72.7% (2026) | 27.3% | Enterprises drive the majority of spend; SMBs grow share faster |
| DX Program ROI (>$500M revenue vs. smaller) | 64% | 11% | Scale enables faster compounding of returns |
| Generative AI Embedded | Higher penetration; 78% of US firms | Catching up; SMB segment growing 20.6% CAGR | Gap is closing as costs fall |
| Agentic AI Deployment Stage | Fully scaled deployment 2x mid-market rate | Mostly experimentation; higher abandonment | Resources determine scalability |
| Primary DX Constraint | Data quality and legacy integration | Budget cycles and talent access | Different problems, different vendor needs |
Sources: Fortune Business Insights1, Mordor Intelligence5, Deloitte16, First Page Sage Agentic AI Adoption Statistics 202618
What this means: Enterprises and mid-market organizations face different transformation problems, not just different scales of the same problem. Enterprises are constrained by integration complexity and data quality across long-tenured legacy environments. Mid-market and SMB organizations are constrained by budget cycles, talent access, and the ability to fund multi-year programs without continuous board-level reaffirmation.
Key Findings
- Large enterprises hold 72.7% of the global digital transformation market in 2026 per Fortune Business Insights1, but mid-market and SMB segments are growing faster at roughly 20.6% CAGR.
- Enterprises report 64% transformation ROI compared to 11% for smaller organizations per Deloitte16, a gap driven primarily by scale-enabled compounding of returns and the ability to fund architectural foundations.
- Enterprises deploy agentic AI in fully scaled production at more than double the rate of mid-market organizations per First Page Sage research18, while mid-market remains largely in experimentation phase with higher abandonment rates.
- 78% of US firms now embed generative AI per Microsoft and IDC research7, but the depth of integration varies significantly by organization size, with enterprises typically achieving production-grade integration faster than mid-market peers.
In Practice
The 64% vs. 11% ROI gap is the single most consequential statistic in this section. In our work, the gap is not driven by enterprise organizations being better at digital transformation. It is driven by their ability to fund the architectural and governance layers that produce compounding returns. Mid-market organizations capable of running enterprise-grade transformation programs typically do so by engaging external senior consultants for the architecture, data, and governance phases, while internal teams handle execution.
The agentic AI deployment gap is widening for similar reasons. Enterprises have the budget headroom to invest in the governance frameworks, validation infrastructure, and senior engineering oversight that agentic AI requires to move from pilot to production. Mid-market organizations that attempt agentic AI deployment without those layers see the high abandonment rates that show up in the research data. The organizations that successfully scale agentic AI in mid-market environments typically partner externally for the governance and architecture work and reserve internal capacity for use-case definition and validation.
Strategic takeaway: Mid-market organizations can capture enterprise-grade transformation outcomes, but the path requires acknowledging that the architectural and governance work cannot be skipped. The organizations that try to compress transformation by skipping foundational phases produce the outcomes reflected in the 11% ROI and high abandonment statistics. The organizations that engage external senior expertise for the foundational layers, while preserving internal ownership of strategy and execution, capture outcomes closer to the enterprise baseline.
Agentic AI as an Acceleration Layer for Transformation
Agentic AI is the technology shift most likely to change digital transformation economics over the next two years. The shift is not from manual to automated. It is from human-only delivery to human-governed delivery in which AI agents handle execution under architectural oversight. The table below summarizes the agentic AI indicators most relevant to transformation programs.
| Indicator | 2026 Value | Trend | Relevance to Transformation |
|---|---|---|---|
| Orgs regularly using AI in at least one function | Nearly 90% | Up from 78% in 2024 | AI now baseline expectation in transformation programs |
| Fortune 500 using active AI agents | 80% | First year measured | Agentic AI moving from pilot to production |
| Enterprise apps embedding agents by end of 2026 | 40% | Up from less than 5% in 2024 | Embedded agents reshape application architecture |
| Agentic AI projects expected to be canceled by end of 2027 (Gartner) | 40% | Stable | Failure rate underscores importance of governance and oversight |
| AI-driven COBOL-to-Java conversion accuracy | 93%+ | Rising | Mechanical conversion improving rapidly; business-logic validation still required |
| Orgs reporting >5% EBIT impact from AI | 5.5% | Stable (McKinsey) | Adoption is broad; measurable enterprise-level impact remains concentrated |
Sources: McKinsey State of AI 20256, Microsoft Security Blog19, Gartner / ServiceNow15, First Page Sage 2026 Agentic AI Adoption Statistics18, DreamFactory20
What this means: Agentic AI is moving from pilot to production faster than most prior enterprise technology shifts, but the failure rate is elevated. Gartner’s projection that 40% of agentic AI projects will be canceled by the end of 2027 underscores that adoption alone does not produce outcomes.15 The transformation programs capturing real acceleration from agentic AI are the ones that pair it with senior engineering oversight, test-gated validation, and clear architectural boundaries.
Key Findings
- 80% of Fortune 500 companies are now using active AI agents per Microsoft’s February 2026 Security Blog19, the first year this has been measured at production scale.
- By the end of 2026, Gartner forecasts that 40% of enterprise applications will embed task-specific AI agents, up from less than 5% in 2024.15
- AI-driven COBOL-to-Java conversion has reached 93%+ accuracy per DreamFactory20, materially changing the cost-benefit calculation for mainframe modernization and the timelines for transformation programs that depend on it.
- Despite nearly 90% of organizations using AI in at least one function, only 5.5% report greater than 5% EBIT impact from AI initiatives per McKinsey’s State of AI 2025.6 This indicates widespread adoption that has not yet translated to enterprise-wide measurable outcomes.
In Practice
David Pitt, Keyhole’s CEO and a partner across multiple AI software vendor ecosystems, has been clear with our team about what is changing in 2026: agentic AI is not a tool we add to existing transformation engagements. It is changing the cost and timeline economics of modernization itself. Keyhole’s agentic AI software development service line, and our work as part of the Claude partner ecosystem, reflect this shift. In our active engagements, we are seeing agentic AI applied within governed, architect-led workflows produce meaningful improvements in delivery speed on modernization and transformation programs.
A recent example: in an AI-accelerated COBOL-to-Spring-Batch modernization, we used agentic AI tools to compress the discovery, analysis, and documentation phases that have historically made legacy migration prohibitively expensive. Manual development effort dropped by approximately 20 to 30%, with strict validation of business logic preserved throughout. In a separate insurance platform modernization engagement, we delivered architecture and execution in approximately five months against an initial estimate of 18 to 24 months, while maintaining enterprise governance and security.
The pattern that makes these outcomes possible is consistent: AI handles the mechanical layers (code analysis, dependency mapping, target-language generation, test scaffolding), and senior architects govern the decisions AI cannot reliably make (target architecture design, business-logic validation, data migration sequencing, and security boundary definition). This is the difference between the McKinsey 94.5% of organizations that deploy AI without enterprise-wide EBIT impact and the engagements that produce measurable acceleration.
Gartner’s projection that 40% of agentic AI projects will be canceled by the end of 202715 is consistent with the abandonment patterns we observe. The projects that fail are typically the ones where AI is deployed without governance, validation, or clear architectural boundaries. The projects that succeed are the ones where AI is treated as an acceleration layer inside an existing governed engineering process, not as a replacement for that process.
Strategic takeaway: Agentic AI is changing the economics of transformation programs, but only when paired with governance and architectural oversight. The organizations that pilot agentic AI without those layers are generating the failure rates and earnings-impact gaps reflected in the McKinsey and Gartner data. The organizations that integrate agentic AI into architect-led delivery workflows are capturing the speed and cost advantages that David has been observing across our client base in 2026.
Need Help Translating These Statistics Into a Transformation Plan?
If your organization is evaluating digital transformation investments in 2026, these statistics highlight the importance of integrating program governance, data readiness, and architectural sequencing early. The difference between successful and stalled transformation programs increasingly comes down to how well these elements are aligned, particularly as AI accelerates certain phases while raising the bar on validation and oversight.
Keyhole Software works with enterprise teams to translate these trends into practical transformation strategies, helping organizations:
- Sequence cloud, modernization, data, and AI investments to produce compounding returns
- Integrate agentic AI into governed, testable delivery workflows
- Modernize legacy systems with architect-governed AI acceleration, including COBOL, .NET, and Java environments
- Design scalable cloud architectures across AWS, Azure, and Google Cloud
- Reduce transformation risk through phased execution and senior architectural oversight
Our 100% U.S.-based senior consultants average 17+ years of experience and support custom software development, cloud-native development, platform engineering, AI integration, and enterprise modernization efforts across industries.
Talk with an expert from Keyhole Software: keyholesoftware.com/contact
References
- Fortune Business Insights. “Digital Transformation Market Size, Share & Industry Analysis.” Available at: https://www.fortunebusinessinsights.com/digital-transformation-market-104878. Accessed May 2026.
- The Business Research Company. “Digital Transformation Market Report 2026.” Available at: https://www.thebusinessresearchcompany.com/report/digital-transformation-global-market-report. April 2026.
- Grand View Research. “Digital Transformation Market Size | Industry Report, 2033.” Available at: https://www.grandviewresearch.com/industry-analysis/digital-transformation-market. 2026.
- MarketsandMarkets. “Digital Transformation Market – Global Forecast to 2031.” Available at: https://www.marketsandmarkets.com/Market-Reports/digital-transformation-market-43010479.html. April 2026.
- Mordor Intelligence. “United States Digital Transformation Market Size, Trends & Forecast.” Available at: https://www.mordorintelligence.com/industry-reports/united-states-digital-transformation-market. January 2026.
- McKinsey & Company. “The State of AI: How Organizations Are Rewiring to Capture Value.” Available at: https://www.mckinsey.com/capabilities/quantumblack/our-insights/the-state-of-ai. Survey fielded June 25 to July 29, 2025; published November 2025. 1,993 respondents in 105 nations.
- Microsoft / IDC. “Microsoft Ignite 2024: 75% of Fortune 500 Companies Using Microsoft AI; $3.70 ROI Per $1 Invested in Generative AI.” Available at: https://ppc.land/microsoft-reports-75-enterprise-ai-adoption-with-3-7x-roi-across-fortune-500-firms-2/. November 2024.
- Market.us. “Digital Transformation Statistics and Facts (2026).” Available at: https://market.us/statistics/information-and-communication/digital-transformation/. April 2026.
- Integrate.io. “50 Statistics Every Technology Leader Should Know in 2026.” Available at: https://www.integrate.io/blog/data-transformation-challenge-statistics/. January 2026.
- Deloitte. “2025 Smart Manufacturing Survey: Smart Manufacturing Is Driving Advantage But Needs Focused Investment and Implementation.” Available at: https://www.deloitte.com/us/en/about/press-room/deloitte-2025-smart-manufacturing-survey.html. Conducted August to September 2024, 600 senior executives at U.S.-headquartered companies with annual revenue of $500M or greater; published 2025.
- IBM. “Cost of a Data Breach Report 2025.” Available at: https://www.ibm.com/reports/data-breach. 2025.
- Whatfix. “Digital Transformation & Tech Adoption by Sector (2026).” Available at: https://whatfix.com/blog/digital-transformation-by-sector/. February 2026.
- Precedence Research. “Cloud Computing Market Size to Hit USD 5,946.84 Billion by 2035.” Available at: https://www.precedenceresearch.com/cloud-computing-market. 2026.
- Grand View Research. “Artificial Intelligence Market Size | Industry Report, 2033.” Available at: https://www.grandviewresearch.com/industry-analysis/artificial-intelligence-ai-market. 2026.
- Gartner / ServiceNow. “40% of Enterprise Applications to Embed Task-Specific AI Agents by End of 2026.” Available at: https://www.gartner.com/en/articles/top-technology-trends-2026. October 2025.
- Deloitte. “Private Company Outlook: Digital and AI Investment.” Available at: https://www.deloitte.com/us/en/about/press-room/deloitte-private-survey-private-companies-shift-digital-and-ai-investment-from-exploration-to-Implementation.html. April 2026.
- Flexera. “2024 State of the Cloud Report.” Available at: https://www.flexera.com/blog/finops/cloud-computing-trends-flexera-2024-state-of-the-cloud-report/. 2024.
- First Page Sage. “Agentic AI Adoption Statistics 2026.” Available at: https://firstpagesage.com/reports/agentic-ai-adoption-statistics. May 2026.
- Microsoft Security Blog. “80% of Fortune 500 Use Active AI Agents: Observability, Governance, and Security Shape the New Frontier.” Available at: https://www.microsoft.com/en-us/security/blog/2026/02/10/80-of-fortune-500-use-active-ai-agents-observability-governance-and-security-shape-the-new-frontier/. February 2026.
- DreamFactory. “Legacy System Modernization Statistics.” Available at: https://www.dreamfactory.com/hub/legacy-system-modernization-statistics. Continuously updated.
More From Keyhole Software
About Keyhole Software
Expert team of software developer consultants solving complex software challenges for U.S. clients.
Share This Post
Join The Thousands Of Devs Who Subscribe
[…] La conclusión para un gerente general es contraintuitiva pero clara: el problema no es el presupuesto, es la ejecución y la adopción. Antes de aprobar el siguiente proyecto conviene auditar cuánto del anterior está realmente en uso. Ver estadísticas. […]
[…] to scale beyond pilot stage; 40% of agentic AI projects projected to be canceled by end of 2027. View → Meltingspot (2025–2026) — 70% digital transformation failure rate; $2.3T annual cost; 65% […]
[…] ; 40% des projets d’IA agentique projetés d’être abandonnés d’ici fin 2027. Voir → Meltingspot (2025–2026) — Taux d’échec de transformation digitale de 70% ; coût […]
[…] companies that don’t. Enterprises capture 64% ROI on transformation spending, according to Deloitte data compiled by Keyhole Software. Smaller organizations average just 11%. Scale-enabled compounding explains most of that gap, […]