
.NET Memory Management with dotMemory
Given the maturity of the .NET Framework and the automated nature of its memory management, many developers are guilty of glossing over (or even outright ignoring) whether their code is optimal in terms of CPU and memory usage. Personally, I have caught myself making sure my code is maintainable, testable, and extendable while forgetting to consider memory management in terms of nonfunctional aspects.
While the .NET runtime does a great job and memory corruption is extremely rare, we should still be concerned with memory management, particularly in large-scale .NET base applications.
This concern isn’t limited to on-premise applications. It’s easy to forget about memory usage with cloud computing. Azure Functions and AWS Lambda have billing structures based upon the average memory size per second of function execution. The direct correlation between memory usage and cost couldn’t be more transparent.
Fortunately, there are many great tools to help profile and analyze your memory footprint. JetBrains has a fantastic tool called dotMemory which makes it easy to profile processes, auto detect issues, perform deep analysis, and determine traffic. dotMemory can be installed as either a stand-alone tool or as a part of the ReSharper package integrated into Visual Studio.
In this post, we’ll show how to use dotMemory to generate a memory profile and analyze a memory leak in a .NET Core application.
Our dotMemory Example
For example, I have the following code hidden away in a console application.
 internal class Program
 {
     private static readonly List<Car> Cars = new List<Car>();
     public static void Main(string[] args)
     {
        var stringGenerator = new RandomStringGenerator();
        var yearGenerator = new Random();
        while (true)
        {
           var year = yearGenerator.Next(1900, 2020);
           var make = stringGenerator.Generate();
           var model = stringGenerator.Generate();
           Cars.Add(new Car { Make = make ,Model = model ,Year = year});
           Console.WriteLine(value:$”{Cars.Count}: year:{year} make:{make} model:{model}”);
        }
     }
 }
This is an infinite loop that adds Car class to a static list causing a memory leak. If I had a large application and needed to find out what was happening, I could start my application in Visual Studio with a profiler attached to it on startup.

After running my application, the following memory profile was generated.

As you can see, the total amount of memory used continued to climb until I killed the process. While the process was running I took two snapshots so that I could dive into the details of the profile.

Looking into Snapshot #2, we first get a general overview from the automatic memory inspection from dotMemory. As you can see the type string and Car make up a large portion of the heap size.

I can also change views on the analysis to get a better idea of how the heap is organized. When I group by type I again see that String and Car make up a large number of instances. If I stopped at this point I might think that I have two memory leaks: one case where many instances of String are leaking and another where Car is leaking.

Fortunately, dotMemory provides other views of analysis so that I can pinpoint the issue. If I change the snapshot profile view to “Dominators,” I’m treated to a nice chart and tree which gives a better picture.
It turns out that nearly the entire object set memory profile is dominated by a list of Car models. The strings we were seeing in the other views were just children to the car classes and actually not a separate leak.

Now that I know a list of Car models is the source of a memory leak, I can determine where the leak is occurring in my code.
If I click on instances, I see the car list at the top.
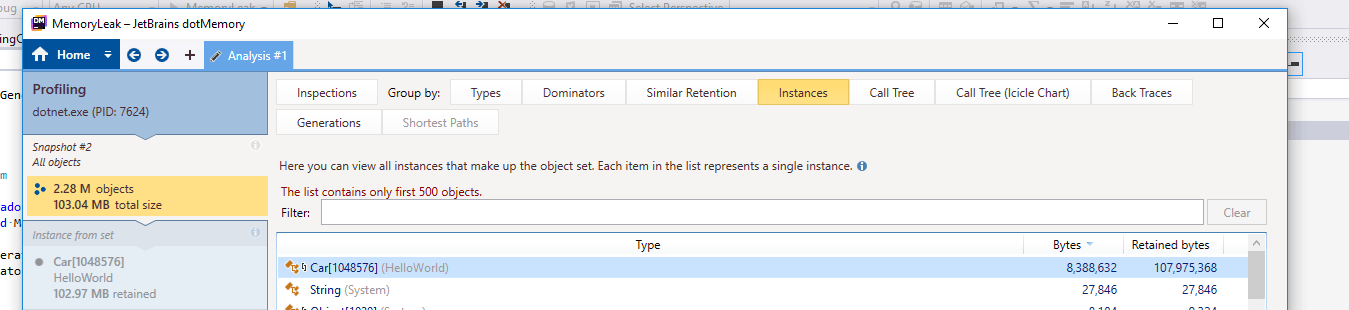
When clicking on the car list/array, I’m talking to the analysis of the instance. The analysis on the instance again provides several metrics on an instance in memory, but I am interested in knowing where the instance can be found.
If I click on the “Create Stack Trace” tab I can see that it can be found in the Program.Main function in the MemoryLeak namespace.

A memory leak like the example just provided would be obvious to anyone executing the application because it would fail quickly and consistently. It is much harder to detect a leak that takes days or weeks to cause a crash…or a leak that doesn’t necessarily cause a crash at all but is just taking up a lot of memory.
Fortunately, dotMemory can be used to profile applications running outside or in Visual Studio. The following are some of the profiling options.

Other Options
While I presented the dotMemory profiler by JetBrains, please be aware that there are many other great alternatives.
Red-gate has a profiler with similar features and price point:
https://www.red-gate.com/products/dotnet-development/ants-memory-profiler/index
Microsoft provides a free CLR profiler for .NET 4:
https://www.microsoft.com/en-us/download/details.aspx?id=16273
Visual Studio 17 has a built-in memory profiler and there are a number of free profilers available on the Microsoft marketplace.
Wrap Up
It is easy to forget about memory consumption in large-scale applications. Using a profiler makes what was once a daunting task much easier and ultimately helps with the scalability and costs of enterprise applications.
Hopefully, I have convinced you to consider profiling memory usage in your applications!
More From Jason Schmidtlein
About Keyhole Software
Expert team of software developer consultants solving complex software challenges for U.S. clients.
Share This Post
Join The Thousands Of Devs Who Subscribe


Hi Would like to know from Dot Memory UI to Visual studio method or object level navigation possible? i tried but only class level navigation working fine. We wanted to exact which method/object causing issue. so that it will be helpful for developers to fix issue asap.
Hello. I’m not aware of a way to directly navigate to the method in Visual Studio from the dotMemory UI. However, the creation stack trace view in dotMemory provides the class method and namespace from which the memory leak is occurring. If you use this information you can use reSharper or Visual Studio keyboard commands/shortcuts to quickly navigate to the problematic method.
JetBrains provides a good example of detecting memory leaks at the folloing url if you have other questions.
https://www.jetbrains.com/help/dotmemory/How_to_Find_a_Memory_Leak.html#t2_step3
Thanks!
Jason
Your article helped me a lot, is there any more related content? Thanks!