The Visual Studio Experience with C# in VS Code
October 24, 2023
There is no doubt that VS Code is one of the most popular development IDEs around these days. With clean layouts and a broad library of extensions that cater to an amazing list of development languages, it’s easy to imagine why it’s so popular. However, when it came to C# development, there were comforts that could be found in Visual Studio but not in VS Code. That is until recently…
This year, Microsoft released an extension for VS Code that helps bring those missing comforts of developing C# in Visual Studio to VS Code: the C# Dev Kit extension, which is approaching 1 million downloads with active updates. If you are an API and UI developer looking to stay in a single IDE, or maybe a Linux developer who is not able to install Visual Studio, this should excite you.
In this post, we’ll walk through some of the features that this extension brings to VS Code.
Getting Started
Let’s open up VS Code! If you don’t already have it installed, start by downloading it for free.
Once VS Code is open, we’ll click on the “Extensions” section of the left ribbon. Next type “C#” into the search bar. You should now see the “C# Dev Kit” in the results. Continue by clicking on “Install,” and it will add the extension (and any other extensions that it relies on).

Our new extensions installed list should look like this:

At this point, we are ready to go!
Hello World! A Solution!
With the dev kit installed, we can start out as every great development endeavor does with a quick “Hello World!” app.
Now, in the command palette, we can create a new project. You may either click on the “Search” bar at the top and type “>” or press the hotkey “Ctrl+Shift+P” to engage the command palette directly. Next, type in “.NET,” select “.NET: New Project,” and continue by selecting “Console App.”

VS Code will ask for you to pick the folder where you’d like to save the project. Select one through the Windows Explorer view. I will name my folder “HelloWorld” and select that. Now that you have selected the folder, VS Code will prompt you to name your project. I will name mine “HelloConsole.”
Now, VS Code will refresh and open the Explorer view in the left ribbon. We want to look a bit further down and select “Solution Explorer” to expand it. This view will be very familiar to Visual Studio C# developers.

From here we can see our dependencies, frameworks, and files. We can also add new projects to the solution contained in the solution within the “HelloWorld” folder.
Just a Hint
We’ll continue by opening the “Program.cs” file. Then, we’ll take a high-level look at what the editor can do with the dev kit extension.
Start by typing in “Console.” You should see the hinting that you might have seen in Visual Studio with IntelliCode. Take note that this also includes showing starred (or most common/popular) functions for the element we’re using.

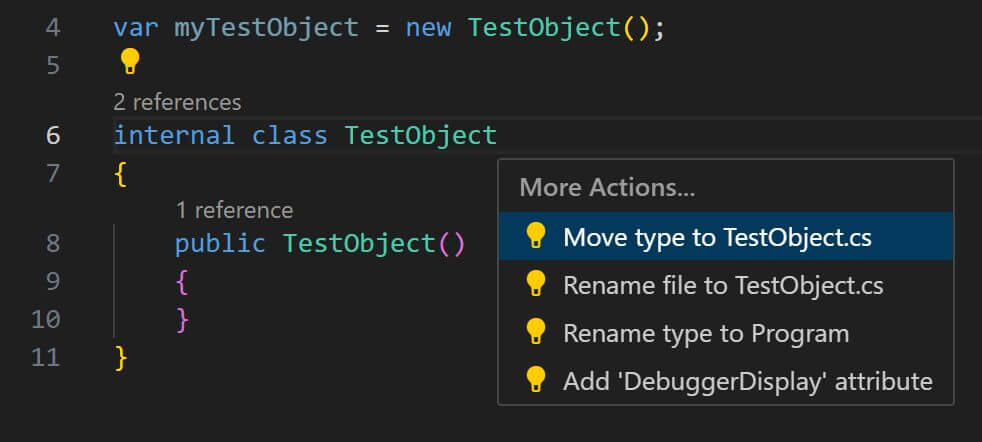
Taking this a step further down, we can create a variable with an object that doesn’t exist to see what error help text is provided. For instance, let’s create a variable that attempts to instantiate an object called TestObject.
This object doesn’t exist, and that’s OK. Notice that the dev kit provides us with a lightbulb icon to click on. Or we could also press the hotkey “Ctrl+Space” to see the same output. This will show us the suggested hints or actions that we could take to help resolve our issue.

To continue, let’s go with the quick fix of “Generate class TestObject” and we’ll see that it quickly creates a shell of an object for us to use.

Let’s take that another step further by continuing with the light bulb by refactoring the object into its own file with “Move type to TestObject.cs:”
You will see that this created a new file within the project called “TestObject.cs.” Since it’s in the root level with the “Program.cs” file, it will be recognized right away.
To view the file, we could always use the “Solution Explorer” view, or from the “Program.cs” file, we could right-click on the variable object and select “Go to Definition” or even “Peek” from the current file.

Snippets
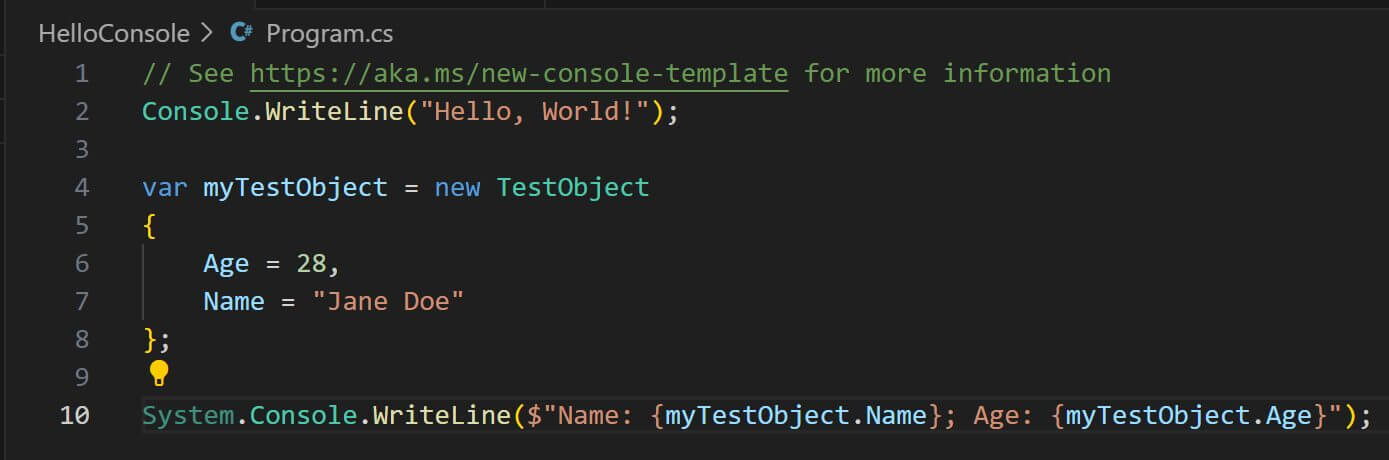
Now, from the peek definition, let’s quickly add two new properties to our “TestObject.cs” file. Let’s use the prop snippet to quickly add an “Age” integer property and “Name” string property in the object:

Next, go back to your “Program.cs” file and make use of this new object. Let’s add some quick details, and we will see that IntelliCode will show our new properties.

Then we can use the cw snippet to add a Console.WriteLine to our “Program.cs” and display data from our object:
Debugging
With our “Program.cs” file updated, we’re ready to test our application. From the editor click on the play icon on the top right, or you can, from the left ribbon, click on Run and Debug and then click the “Run and Debug” button.
You could also hit F5 and select “C#” if prompted. A terminal window will now open and display the output of our console application.

Hello world!
Scratching the Surface
We’ve just started scratching the surface of what this extension provides for us in VS Code. I hope that you’ll continue testing it out and learning more about it. You can find further resources on the C# Dev Kit extension on the VS Code website. Or, check out the Keyhole Dev Blog for more content!
Good luck! And happy coding!
More From Adam Costenbader
About Keyhole Software
Expert team of software developer consultants solving complex software challenges for U.S. clients.
Share This Post
Related Posts
Join The Thousands Of Devs Who Subscribe


Discuss This Article
Subscribe
Login
0 Comments
Oldest