
Power BI: Diving Deeper into Reporting Tools (Part 1) Connecting Your Data
In today’s data-driven world, organizations have access to vast amounts of data, but how exactly do you interpret those millions of rows of data? This is where data visualization comes into play, transforming complex data sets into easily understandable visuals. Data visualization is, without a doubt, one of the most important aspects of Business Intelligence (BI).
In one of my previous blogs, I talked about BI and why it is important for a company to practice and implement this in their workspace. Now, in this blog series, we are going to dive deeper into a data visualization tool called Power BI.
Overview of Power BI
There are multiple Data Visualization tools out there, but the most popular one as of lately is Power BI. The reason? Simple; it’s a Microsoft product, so it’s easy for most companies to bundle Power BI into their already existing Microsoft stack. Power BI gives you the power to connect multiple data sources to a central tool where you can further manipulate the data, create measures with complex calculations, and then create interactive and invigorating visualizations that will keep the end user intrigued for hours.
The great thing about Power BI is that it’s very user friendly when it comes to connecting data and creating some simple reports and dashboards. Anyone can learn the basics relatively quickly, and there are a TON of sources out there where you can easily look for answers for your challenging questions. Once the Dashboards are created, you can easily share them with others by publishing the final product on the Power BI Server, a website where you can add users to interact with the report.
There are three big things about Power BI I want to expand further upon: Connecting your Data, Building Dashboards, and Publishing to Power BI Server for Users. Since there is a lot to cover for these topics, I am going to talk about each one in separate blogs.
In part one (this blog), we are going to talk about how to connect and manipulate your data for your Power BI report.
Connecting and Manipulating Data
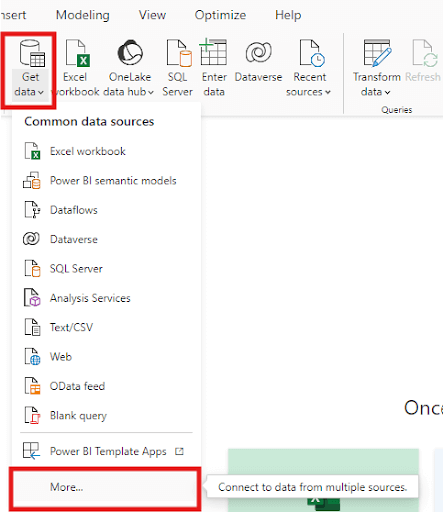
First things first, you need to connect your data. Power BI has the ability to connect to many sources, and you can find them on the Home tab when you first open up your New Power BI file.

Power BI provides some shortcuts to connecting data within the Data section, and you can already see that it has some decent options right off the bat. However, there are far more. Click on the Get Data button and click More… at the bottom of the dropdown menu.
A window pops up that reveals the rest of the options for importing data; notice how small the scroll bar is on the right side? There are a lot of options, so take your time exploring what Power BI has to offer.
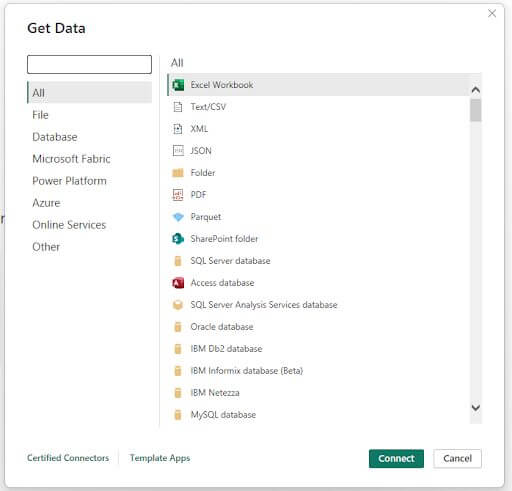
For this blog, I downloaded some sample sales data and saved it as a CSV file, so I simply clicked on the Text/CSV in the list and found the file where I saved it. A window pops up with a preview of the data with Load, Transform Data, and Cancel buttons at the bottom. We are going to click on Transform Data.

This takes you to the Power Query Editor where you can further transform your raw data. If you connect to a database, your selected tables will show up on the left side under Queries.
The ribbon at the top provides multiple options where you can further shape your data. The right side has Query Settings where you can change the name, edit the Applied steps in which you took to shape your data, and other properties. In this example, we are going to simply change the data type for ORDERDATE to Date and not Date/Time.

From here, there are a number of tasks you can do, like add custom columns, add more data sources, manage parameters, merge queries, and so much more. This is a crucial area of Power BI to help shape your data.
One last step I want to highlight is the Advanced Editor button found in the top Ribbon under Query.

When you select Advanced Editor, a window opens where you can see the M code behind what is used to pull in the data. This is automatically generated when you go through the steps above, but you have the freedom to edit it yourself. When you connect to an SQL database, you can actually use an M Code statement where you can imbed an SQL Query, like this example I found online.
let
    Source = Sql.Database("red-apps01\fmast", "FMAST10", [Query="WITH RPL (PART, SUBPART, QUANTITY) AS#(lf)(#(lf)SELECT ROOT.[Parent Part No], ROOT.[Component Part No], ROOT.[Qty Required Per Parent]#(lf)        FROM vAssemblies ROOT#(lf)        WHERE ROOT.[Parent Part No] = '536304'#(lf)UNION ALL#(lf)        SELECT CHILD.[Parent Part No], CHILD.[Component Part No], CHILD.[Qty Required Per Parent]#(lf)        FROM RPL PARENT, vAssemblies CHILD#(lf)        WHERE PARENT.SUBPART = CHILD.[Parent Part No]#(lf))#(lf)SELECT DISTINCT PART, SUBPART, QUANTITY#(lf) FROM RPL#(lf)  ORDER BY PART, SUBPART, QUANTITY;"])
in
    Source
This is the window that appears:

Finally, when you are done making changes to your data, you will click the Close & Apply button on the far left in the top ribbon.

Once you click that button, the window will close and you will be looking at the main Power BI platform. On the right side, you can find the data you just helped bring in.
Wrapping It Up
In this blog, we began to dive deeper into Power BI. There are a lot of steps in creating your dashboard, and we’re going to break it down into 3 different parts.
This time, we covered the first major step, Connecting your Data. We dove into how to connect your data to Power BI with Excel, but there are MANY different ways to connect your data – as illustrated above. I encourage you to do your own research on the topic.
In part 2, we’ll talk more about building dashboards, and in part 3, we’ll cover publishing to Power BI Server. I hope you’re excited to hear about how to start building visualizations! Stay tuned and subscribe for the next Blog coming soon.
More From Caven Andersen
About Keyhole Software
Expert team of software developer consultants solving complex software challenges for U.S. clients.
Share This Post
Join The Thousands Of Devs Who Subscribe


Discuss This Article
Subscribe
Login
0 Comments
Oldest