Most data migrations run over time or budget. Here are the root causes, a gated phase-by-phase plan, AI guardrails, and a checklist for CEOs and CIOs.
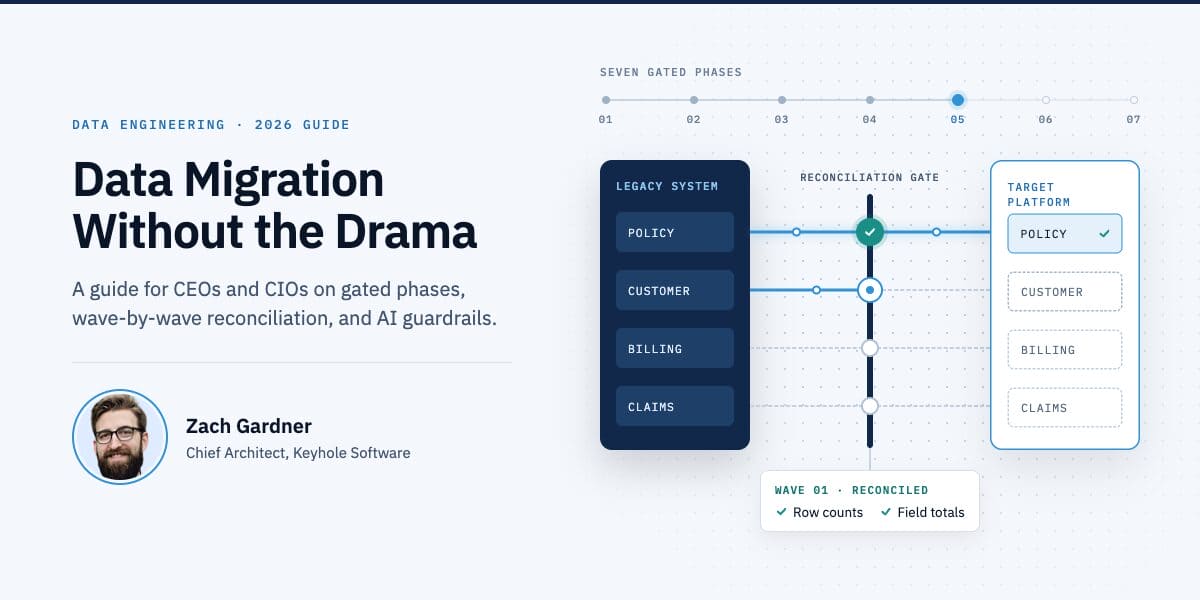

Most data migrations run over time or budget. Here are the root causes, a gated phase-by-phase plan, AI guardrails, and a checklist for CEOs and CIOs.
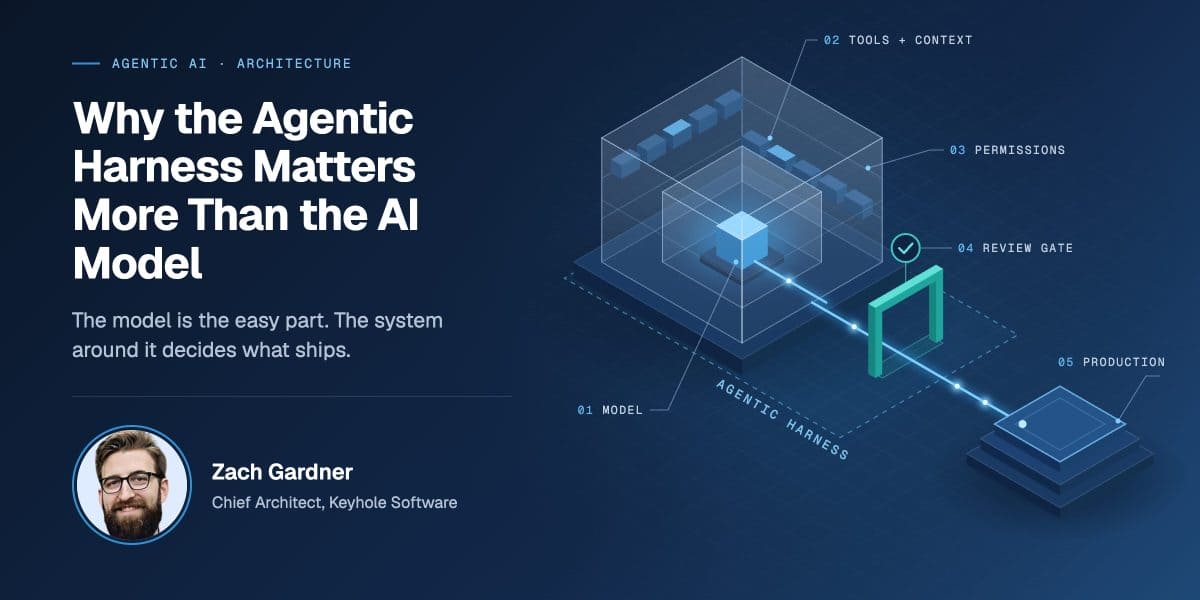
The same AI model can cost 5x more depending on the harness around it. Here’s what an agentic harness is, what we’d build first, and the controls we won’t skip.
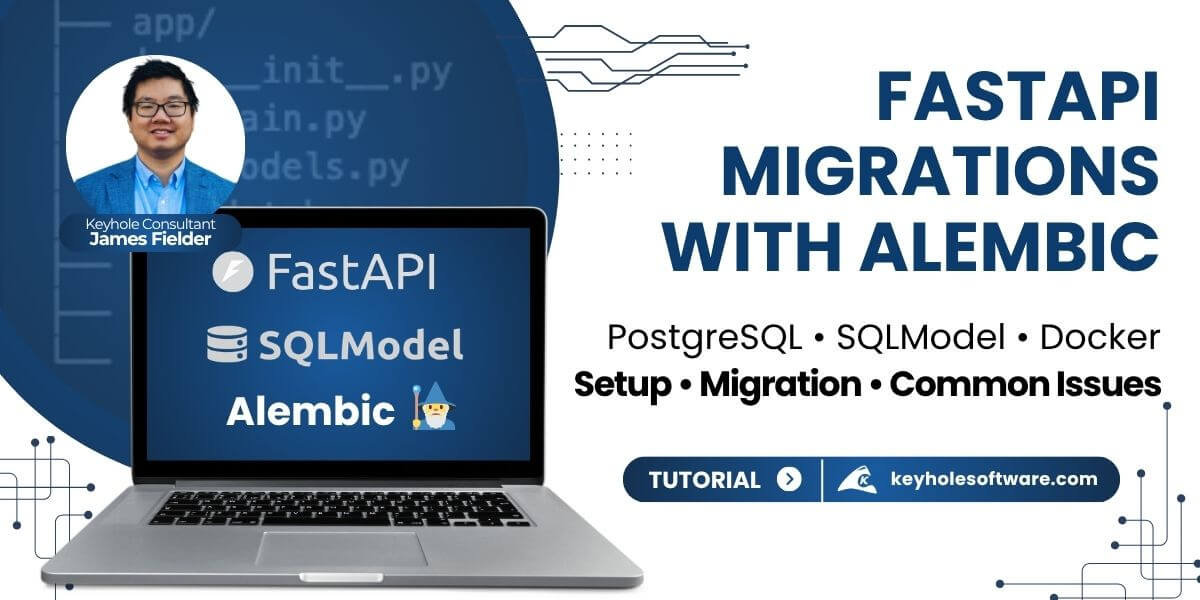
When building a FastAPI project with PostgreSQL, you need a reliable way to manage your database schema over time. As your application evolves, simple table creation is not enough. You need a way to safely apply, track, and roll back changes.
Alembic provides a structured, version-controlled approach to database migrations. In this guide, we’ll walk through how to set up Alembic with FastAPI, SQLModel, and PostgreSQL, including common issues you’ll run into when working with Docker.
Learn how to use Amazon S3 manifests to safely reprocess millions of S3 objects at scale without data ambiguity or production incidents. As consultants, we operate in the realm of clients with mature systems. One of the most common places for those systems is AWS. Amazon’s S3 (Simple Storage Service) remains one of the most popular enterprise storage solutions. Let’s …

In today’s data-driven world, organizations have access to vast amounts of data, but how exactly do you interpret those millions of rows of data? This is where data visualization comes into play, transforming complex data sets into easily understandable visuals. Data visualization is, without a doubt, one of the most important aspects of Business Intelligence (BI).
In one of my previous blogs, I talked about BI and why it is important for a company to practice and implement this in their workspace. Now, in this blog series, we are going to dive deeper into a data visualization tool called Power BI.