Most data migrations run over time or budget. Here are the root causes, a gated phase-by-phase plan, AI guardrails, and a checklist for CEOs and CIOs.
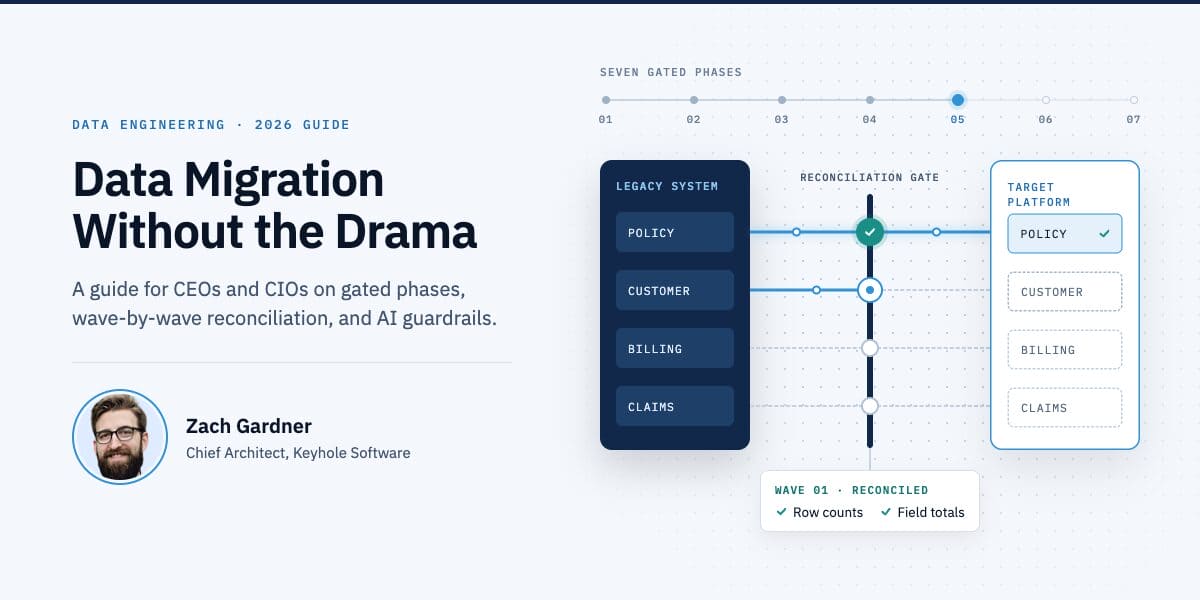

Most data migrations run over time or budget. Here are the root causes, a gated phase-by-phase plan, AI guardrails, and a checklist for CEOs and CIOs.

In today’s data-driven world, organizations have access to vast amounts of data, but how exactly do you interpret those millions of rows of data? This is where data visualization comes into play, transforming complex data sets into easily understandable visuals. Data visualization is, without a doubt, one of the most important aspects of Business Intelligence (BI).
In one of my previous blogs, I talked about BI and why it is important for a company to practice and implement this in their workspace. Now, in this blog series, we are going to dive deeper into a data visualization tool called Power BI.