
Agentic AI in the Software Development Lifecycle: 2026 Adoption and Impact Data
Agentic AI has moved well past the pilot stage for code generation, but adoption remains uneven across the rest of the software development lifecycle. Coding assistants are now mainstream; testing, code review, CI/CD, and incident response are each at very different points on the adoption curve, with very different levels of measured payoff.
This report compiles current 2026 data on where agentic AI is actually being deployed across the SDLC, what teams are reporting in productivity and ROI terms, and how the market for these tools is evolving. The pattern that emerges is not a single adoption curve but several curves moving at different speeds, and the stages generating the most measured value are not always the stages with the broadest usage.
Agentic AI Trends Covered in This Report
- Agentic AI adoption rates across every stage of the SDLC, from planning through incident response
- Adoption patterns by organization size, from small teams to 5,000+ employee enterprises
- Reported productivity gains by stage, including the delivery-stability trade-offs DORA has flagged
- ROI and code-share metrics for agentic deployments, including how much AI-written code is currently in production
- Use case maturity across code generation, testing, code review, CI/CD, and incident response
- Market size, vendor landscape, and build-versus-buy patterns for AI-powered SDLC tooling
Note on sourcing and methodology: Figures below are drawn from multiple 2025-2026 analyst and research sources, including Gartner, McKinsey, GitHub/Microsoft, the Stack Overflow and JetBrains developer surveys, and Google Cloud’s DORA research program. From late 2025 through early 2026, our research team compiled agentic AI adoption and impact data across these sources. Because analyst estimates vary, sometimes significantly, depending on methodology and survey population, we present ranges and cite multiple sources side by side rather than treating any single figure as definitive. See numbered references at the end of this article.
How Keyhole Software Uses These Statistics
Keyhole Software tracks these adoption and productivity trends as part of our ongoing work in AI-accelerated development, legacy modernization, and enterprise software delivery. As a U.S.-based custom software and consulting firm with senior consultants averaging 17+ years of experience, we apply these statistics in real planning work with CTOs and engineering leaders, using them to decide where agentic AI is mature enough to deploy, where it still requires close human oversight, and how to sequence adoption across a development organization.
The statistics in this report are not theoretical. They reflect the conditions we encounter in active AI client engagements, including agentic and AI-accelerated legacy modernization, RAG-based enterprise AI systems, and delivery work inside the Claude partner ecosystem. Where the data points to a market trend, we explain how that trend shows up in real delivery work and what engineering leaders should consider before extending agentic AI into a new part of the pipeline.
Key Finding
Adoption of agentic AI is highly uneven across the SDLC: roughly 84-90% of developers now use AI tools for coding, but only about 13% of teams have AI operating across the full development lifecycle, and only around 22% have deployed AI coding agents specifically (versus simpler autocomplete-style assistants). The stages showing the highest adoption, code generation and testing, are not the same stages showing the highest reported ROI, which analysts point to code review and incident response instead.
Adoption Across the SDLC
Adoption of agentic AI is not a single number. It looks very different depending on which stage of the SDLC you’re measuring. Code generation adoption has approached near-ubiquity among professional developers, while planning, CI/CD, and maintenance stages lag well behind. The table below tracks adoption by stage from 2024 through 2026, followed by a breakdown of how adoption varies by team size and the broader year-over-year trend.
Agentic AI Adoption Rate by SDLC Stage, 2024-2026
| SDLC Stage | 2024 | 2025 | 2026 |
|---|---|---|---|
| Planning & Requirements | < 10% | 10% – 15% | 15% – 25% |
| Coding & Code Generation | 40% – 50% | 65% – 76% | 84% – 90% |
| Testing & QA | 20% – 30% | 40% – 50% | 55% – 64% |
| Deployment & CI/CD | 5% – 10% | 10% – 15% | 13% – 22% |
| Maintenance & Incident Response | 10% – 15% | 20% – 25% | 25% – 30% |
Sources: 3, 7, 8, 11, 12
Caveat: Adoption figures blend individual tool use with team-level, governed deployment. A developer piloting a tool on their own laptop and an organization with standardized tooling, code ownership, and audit trails are different signals, and this data does not separate the two.
What this means: Adoption is not one curve. Code generation is now a baseline expectation for professional developers, while planning, CI/CD, and maintenance remain early-stage even in 2026. The stages showing the fastest adoption growth are also the ones where AI output is easiest to verify line by line; the stages lagging behind are the ones where a mistake is more expensive to catch after the fact, which is a reasonable explanation for why teams are moving cautiously in CI/CD and incident response even as they’ve embraced coding assistants.
Key Findings
- Coding and code generation is the most mature stage, reaching an estimated 84-90% adoption in 2026, up from 40-50% in 2024.
- Testing and QA has grown the second fastest, from 20-30% adoption in 2024 to 55-64% in 2026.
- Deployment and CI/CD remains the least mature stage tracked, at 13-22% adoption even in 2026.
- Only about 13% of teams report AI operating across the full SDLC, and roughly 22% have deployed true AI coding agents, as distinct from simpler autocomplete-style assistants.
In Practice
In client engagements, we see the same unevenness the data describes, but the practical reason is usually about verification cost, not technology maturity. Code generation adoption moved fastest because a developer can review a generated function in about the same amount of time it takes to write one from scratch. CI/CD and incident response are different: an agent that opens a pull request is easy to review before it merges, but an agent with the authority to promote a build to production or restart a service is operating in a space where a wrong call has immediate, hard-to-reverse consequences.
In our experience, the gap between individual experimentation and organization-wide, governed adoption is where most engagement conversations with CTOs actually start, and it’s a more useful dividing line than the adoption percentages themselves. A recent example: on a Kansas City insurance client’s platform replacement, architect-led, repository-integrated agentic workflows delivered roughly 3-4x the pace of a comparable non-agentic effort without adding headcount, with zero reported security incidents in a regulated environment. Governance wasn’t a drag on speed there, it was what made the speed defensible.
Strategic takeaway: Teams should expect adoption to keep climbing across every stage, but the sequencing in this data is instructive. The safest place to extend agentic AI next is usually the stage where output is easiest to verify before it has consequences, which is why testing and code review are typically where we recommend clients expand agentic AI use before extending it into CI/CD or incident response.
Aggregate adoption figures also mask a wide gap by organization size. Larger enterprises are the most likely to be actively experimenting with agentic AI, but they’re also the slowest to move from experimentation into full production deployment, largely due to governance, security, and compliance review. Smaller and mid-size teams tend to move faster end-to-end simply because they have fewer approval layers between a developer trying a new tool and that tool being used on real work.
Adoption by Team Size and Year-over-Year Trend
| Team Size | 2026 Adoption Pattern | YoY Trend |
|---|---|---|
| Small teams (< 50 developers) | Fast adoption of individual tools; limited governance friction | Among the quickest to move from trial to daily use |
| Mid-size teams (50-500 developers) | Highest reported growth rate; tools increasingly standardized team-wide | Fastest-growing segment as of 2026 |
| Large enterprise (5,000+ employees) | ~40% platform-level adoption (e.g., Copilot Enterprise); 80%+ experimenting | Highest experimentation rate, slower production rollout |
Sources: 1, 2, 6, 9
Caveat: Faster adoption at smaller team sizes does not imply better-managed risk. This data measures speed of adoption, not quality of governance around that adoption, and the two can move in opposite directions.
What this means: Aggregate adoption figures obscure a real divide by organization size. Large enterprises experiment the most but move to production the slowest, largely because governance, security, and compliance review sit between a developer’s first successful trial and that tool being cleared for use on real production systems. Mid-size teams are growing adoption the fastest because they have enough scale to standardize tooling without the multi-layer approval process large enterprises carry.
Key Findings
- Large enterprises (5,000+ employees) show the highest experimentation rate, at 80%+, but platform-level adoption trails at roughly 40%.
- Mid-size teams (50-500 developers) report the fastest year-over-year growth as of 2026, driven by standardizing tools team-wide rather than leaving adoption to individual developers.
- Small teams (under 50 developers) move from trial to daily use the fastest, reflecting fewer approval layers between adoption and use.
- Organizations that provide dedicated learning time for AI tools see adoption increase substantially faster than those that don’t.
In Practice
This is one of the clearest patterns we see across client engagements of different sizes. Enterprise clients almost always have more internal AI experimentation happening than official adoption metrics capture, because individual developers and teams pilot tools well before security, legal, and compliance sign off on organization-wide use. The 40% platform-level adoption figure among large enterprises is closer to what we see reflected in formal rollout timelines; the 80%+ experimentation figure is closer to what we see happening informally, sometimes without IT’s full visibility into which tools are already in use.
On the smaller-team side, we see the inverse trade-off: fewer approval layers get tools into developers’ hands faster, but we also see smaller organizations skip the code review, testing, and audit practices that larger, more risk-averse organizations build in from the start.
Strategic takeaway: Organization size changes the adoption bottleneck, not the destination. Enterprises should expect governance review to remain the primary constraint on rollout speed, and should start that review earlier rather than waiting for pilots to prove out. Smaller organizations moving quickly should treat the absence of approval friction as a reason to build governance intentionally, not as evidence that governance isn’t needed.
The overarching year-over-year signal is unambiguous even if individual stage numbers vary by source: roughly 90% of developers were using some form of AI tool at work by early 2026, up from about 76% in 2024, and organizations that provide dedicated learning time for AI tools see adoption increase substantially faster than those that don’t.
Productivity and Impact
Reported productivity gains vary sharply by SDLC stage, and not always in the direction teams expect. Coding speed gains are the most consistently cited figure, but DORA’s research is a useful counterweight: it finds that AI adoption is associated with higher throughput and modestly higher software delivery instability at the same time, which is why the productivity story below includes both the upside and the friction analysts are flagging.
Reported Productivity Gains by Stage
| Stage | Reported Gain | Notes |
|---|---|---|
| Coding | Up to 55% faster task completion | GitHub/Microsoft study of 4,800 developers; commit volume up ~43% in AI-assisted teams |
| Code Review | PRs per developer up ~20% | Incidents per pull request also rose ~23.5%, an unintended trade-off worth monitoring |
| Testing & QA | 64% report significant gains | Test generation and coverage cited as the single biggest year-over-year improvement |
| Deployment / Release | Throughput up ~16% at scale | Booking.com example, 3,500 engineers; DORA: +25% AI usage links to +3.4% code quality, +7.5% documentation quality |
| Incident Response | Up to 30% faster resolution | Reported among enterprises using AI agents in IT operations |
Sources: 4, 5, 7, 9, 10
Caveat: Reported gains describe task-level and volume-level output, such as commits or completed tasks, not necessarily business value delivered or delivery stability, which is a distinct measurement DORA tracks separately.
What this means: Reported productivity gains are real, but they arrive with friction that raw adoption numbers don’t show. DORA’s finding that AI usage correlates with both higher throughput and modestly higher delivery instability is the most important nuance in this data: it suggests teams are producing more without automatically producing more reliably, which is a different outcome than “AI makes software delivery better” on its own.
Key Findings
- Coding tasks are completed up to 55% faster in controlled studies, with commit volume up approximately 43% among AI-assisted teams.
- Code review shows a productivity trade-off: pull requests per developer are up approximately 20%, but incidents per pull request rose approximately 23.5% in the same data.
- Testing and QA shows the strongest reported satisfaction, with 64% of teams reporting significant gains, concentrated in test generation and coverage.
- DORA research links a 25% increase in AI usage to a 3.4% improvement in code quality and a 7.5% improvement in documentation quality, alongside the throughput and stability trade-offs noted above.
In Practice
We see the code-review trade-off in this data play out directly in client work. AI tools make it easy to generate more pull requests, more code, more surface area, faster than any human-only team could produce. That is a genuine productivity gain. But it shifts the bottleneck downstream to review capacity, and if review practices don’t scale alongside code generation, the incident rate creeps up exactly the way the data shows. The teams that avoid this outcome are the ones that treat code review capacity as a constraint to solve for before scaling AI-assisted output, not as an afterthought.
In some engagements we’ve seen commit volume rise while cycle time for a complete, reviewed, deployed feature stayed roughly flat, because the review and testing stages didn’t scale at the same rate as code generation. When a client asks us to help interpret a productivity statistic like the ones above, the first question we ask is which stage of delivery, not just which stage of coding, actually got faster.
Strategic takeaway: The productivity gains in this data are real but partial. Teams that only measure coding speed will overstate the benefit of agentic AI; teams that also track downstream metrics, incident rate, review latency, and delivery stability, get a much more accurate picture of whether AI adoption is translating into faster, safer delivery or just faster code generation.
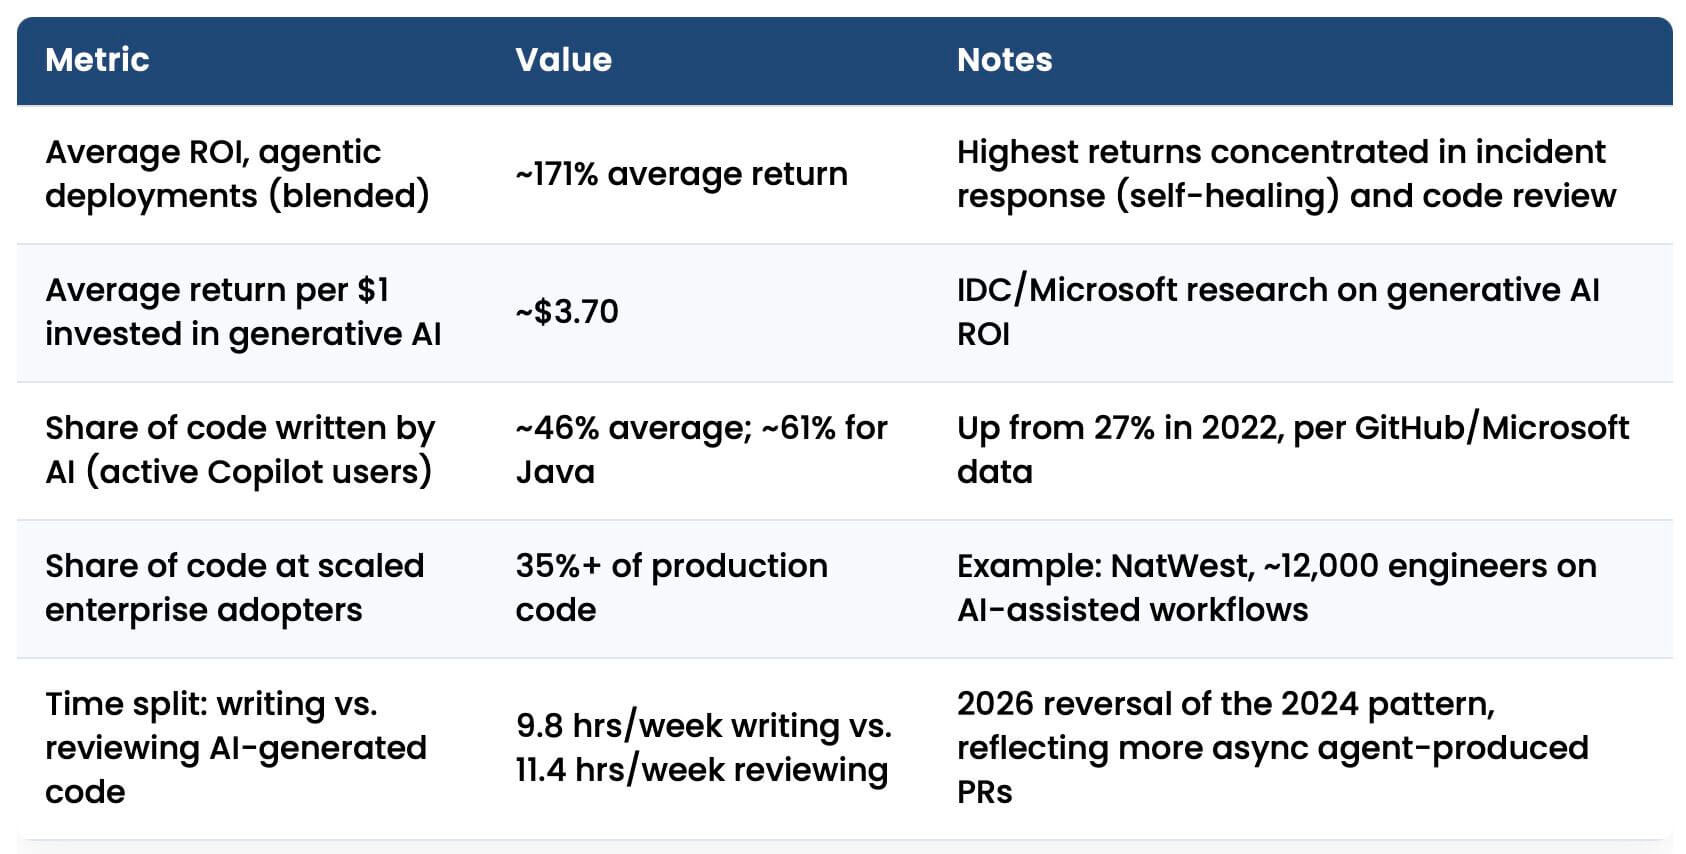
Productivity gains are one measure; return on investment is another, and the two don’t always point to the same stages. ROI data suggests the stages generating the most measured value aren’t necessarily the ones with the highest usage. Code review and incident response show up repeatedly as the highest-return use cases even though they trail code generation in raw adoption.
ROI by Use Case and Share of Code Written or Reviewed by AI
| Metric | Value | Notes |
|---|---|---|
| Average ROI, agentic deployments (blended) | ~171% average return | Highest returns concentrated in incident response (self-healing) and code review |
| Average return per $1 invested in generative AI | ~$3.70 | IDC/Microsoft research on generative AI ROI |
| Share of code written by AI (active Copilot users) | ~46% average; ~61% for Java | Up from 27% in 2022, per GitHub/Microsoft data |
| Share of code at scaled enterprise adopters | 35%+ of production code | Example: NatWest, ~12,000 engineers on AI-assisted workflows |
| Time split: writing vs. reviewing AI-generated code | 9.8 hrs/week writing vs. 11.4 hrs/week reviewing | 2026 reversal of the 2024 pattern, reflecting more async agent-produced PRs |
Sources: 4, 6, 8, 13
Caveat: Share-of-code-written-by-AI figures measure generation volume, not code that ships to production without human review. ROI figures reflect averages across a wide range of program scopes and maturity levels.
What this means: ROI is concentrated in stages that trail code generation in raw adoption, a pattern that echoes what the SDLC-stage adoption data already showed. Incident response and code review, both comparatively early-stage in terms of usage, are producing the strongest reported returns among agentic deployments, which suggests teams that have moved carefully into these stages are capturing outsized value relative to teams still primarily using AI for code generation alone.
Key Findings
- Agentic deployments report a blended average ROI of approximately 171%, with the highest returns concentrated in incident response (self-healing systems) and code review.
- Generative AI overall returns approximately $3.70 per $1 invested, per IDC and Microsoft research.
- AI now writes approximately 46% of code among active Copilot users on average, and approximately 61% for Java specifically, up from 27% in 2022.
- At scaled enterprise adopters like NatWest (approximately 12,000 engineers), AI-assisted workflows account for 35%+ of production code.
In Practice
The 171% blended ROI figure is a useful headline, but in our experience it compresses a wide range of outcomes into one number. Engagements where a client extends agentic AI into a narrow, well-defined use case, self-healing incident response for a known failure pattern, for example, tend to land near or above that figure. Engagements where a client tries to apply agentic AI broadly across a poorly scoped set of use cases tend to land well below it, and sometimes don’t clear a positive return within the measurement period at all.
In every engagement we’ve supported, we ensure human reviewers remain in the loop for production deployment. A useful distinction we bring into planning conversations: “AI wrote X% of this code” and “X% of our code ships without human review” are very different claims, and it’s worth confirming which one a client’s own internal metrics are actually measuring before comparing them against industry figures like these.
Strategic takeaway: ROI is highest where teams have been most selective about scope, not where they’ve deployed AI most broadly. Organizations planning their next agentic AI investment should prioritize narrow, well-defined use cases with clear success criteria over broad rollouts, and should expect the highest returns to concentrate in stages, like incident response and code review, that require more governance to deploy safely, not less.
Use Cases by Stage
Five use cases dominate current agentic AI deployment in software engineering: code generation, automated testing, code review, CI/CD orchestration, and incident response. They sit at very different points on the maturity curve. Code generation is now table stakes; CI/CD orchestration remains the least mature, since handing pipeline decision-making to an agent requires a level of trust most engineering organizations haven’t reached yet.
Top Agentic Use Cases by Adoption Maturity
| Use Case | Adoption Maturity | Example Platforms |
|---|---|---|
| Code Generation | Most mature; near-universal individual use | GitHub Copilot, Cursor, Claude Code, Windsurf |
| Automated Testing | Growing rapidly; strong reported gains | IDE-integrated and standalone AI test-generation tools |
| Code Review | Fast-growing, increasingly agentic | CodeRabbit, Qodo, Greptile, Sourcery, PR-Agent |
| CI/CD & Pipeline Orchestration | Least mature; lowest current adoption | CircleCI, GitHub Agentic Workflows, Azure SRE Agent |
| Incident Response | Emerging, but highest reported ROI where deployed | IBM Bob, Azure SRE Agent, custom self-healing systems |
Sources: 7, 9, 10, 14
Caveat: “Adoption maturity” describes how widely a use case has been deployed, not how reliable it is once deployed. A use case can be immature in terms of adoption but perform well within a narrow, well-governed scope.
What this means: Maturity and adoption track closely for code generation and testing but diverge for CI/CD and incident response. CI/CD orchestration remains the least mature use case because handing pipeline decision-making to an agent requires a level of institutional trust most engineering organizations haven’t built yet, not because the underlying technology is immature.
Key Findings
- Code generation is the most mature use case, with near-universal individual adoption via platforms like GitHub Copilot, Cursor, Claude Code, and Windsurf.
- Automated testing is growing rapidly, with the strongest reported year-over-year gains of any use case tracked.
- CI/CD and pipeline orchestration remains the least mature, with the lowest current adoption among the five use cases tracked.
- Incident response is emerging but already shows the highest reported ROI where deployed, reflecting a small number of teams deploying it carefully rather than broad rollout.
In Practice
We see this maturity curve reflected directly in what clients ask us to help build versus what they ask us to help govern. Code generation and testing requests are almost always about tool selection and workflow integration at this point, questions like which platform, how to roll it out, how to measure adoption. CI/CD and incident response requests are almost always about governance first: what guardrails need to exist before an agent gets any authority over a production pipeline, what the rollback plan looks like, and who is accountable when an agent makes a bad call.
Incident response is a good example of exactly that pattern in this data: low overall adoption, high reported ROI where teams have actually deployed it, which is why we treat adoption maturity and deployment reliability as two separate questions when a client asks whether they’re “behind” on a given use case.
Strategic takeaway: Maturity and value don’t move in lockstep. The stages with the highest reported returns aren’t the ones with the broadest adoption, rather they’re the ones where teams have been more selective about where they hand off control, which is reflected in how much of the SDLC currently runs autonomously versus with a human still reviewing the output.
Highest-Value Stages and Autonomous vs. Human-in-the-Loop Share
| Dimension | Data |
|---|---|
| Highest-value stages by reported ROI | Incident response (self-healing) and code review lead reported returns among agentic deployments |
| Full-lifecycle autonomous deployment | ~13% of teams report AI operating across the full SDLC |
| Agent-level deployment (vs. basic autocomplete) | ~22% have deployed AI coding agents specifically, as distinct from simpler assistants |
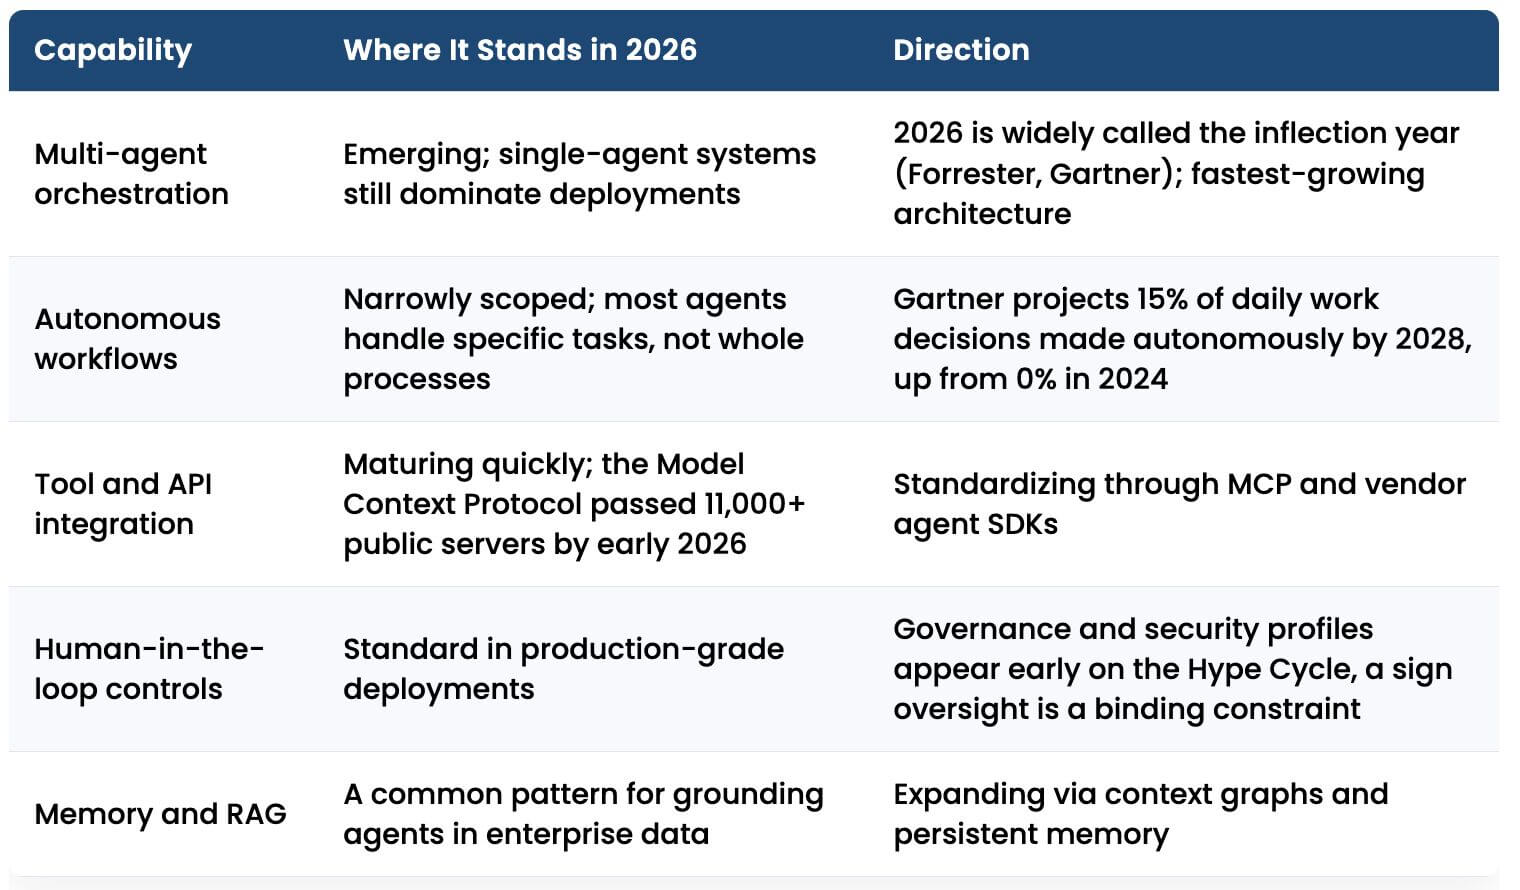
| Human-in-the-loop share | Majority of production use remains human-reviewed; Gartner notes fully autonomous agents aren’t ready for most enterprise use cases |
Sources: 1, 9, 14
Caveat: Full-lifecycle and agent-level adoption figures like these have been debated by analysts on sample size and definitional grounds. We cite them as directional indicators of how far most organizations are from full autonomy, not precise universal benchmarks.
What this means: The stages generating the most reported value aren’t the stages with the broadest deployment. Incident response and code review lead on ROI while remaining comparatively early in adoption, which tells us the value in agentic AI right now is concentrated among teams that have been deliberate about where they extend agent authority, not teams that have deployed the most broadly.
Key Findings
- Only about 13% of teams report AI operating across the full SDLC.
- About 22% have deployed true AI coding agents, as distinct from simpler autocomplete-style assistants.
- The majority of production AI use remains human-reviewed; Gartner notes that fully autonomous agents aren’t ready for most enterprise use cases.
- Incident response (self-healing) and code review lead on reported ROI despite trailing code generation in raw adoption.
In Practice
The human-in-the-loop figure is consistent with what we build into every agentic AI engagement, regardless of industry. Even in engagements where the client’s ultimate goal is a highly autonomous system, we structure the rollout so a human remains in the approval loop until the system has a track record in production, then expand any autonomy incrementally and only within clearly bounded decision types. Gartner’s point that fully autonomous agents aren’t ready for most enterprise use cases matches what we’ve observed directly: the risk isn’t usually that the agent makes a wrong decision, it’s that a wrong decision at 2 a.m. with no human review can compound before anyone notices.
The 13% full-SDLC figure is likely to be read, on its own, as a warning sign, “why hasn’t this scaled further.” In our experience it’s better read as a sign of appropriate caution. Full-lifecycle autonomous deployment is a high bar, and the organizations most likely to have reached it are not necessarily the most sophisticated; they may simply be the ones with the least at stake if something goes wrong. We’d be more concerned about a client racing toward that 13% cohort without the governance to support it than about a client taking longer to get there.
Strategic takeaway: Full-lifecycle, fully autonomous AI deployment is not the near-term goal for most engineering organizations, and this data suggests it shouldn’t be. The organizations capturing the strongest reported ROI are the ones extending agent authority carefully into a small number of well-governed use cases, not the ones chasing full-SDLC autonomy for its own sake.
Market and Tooling
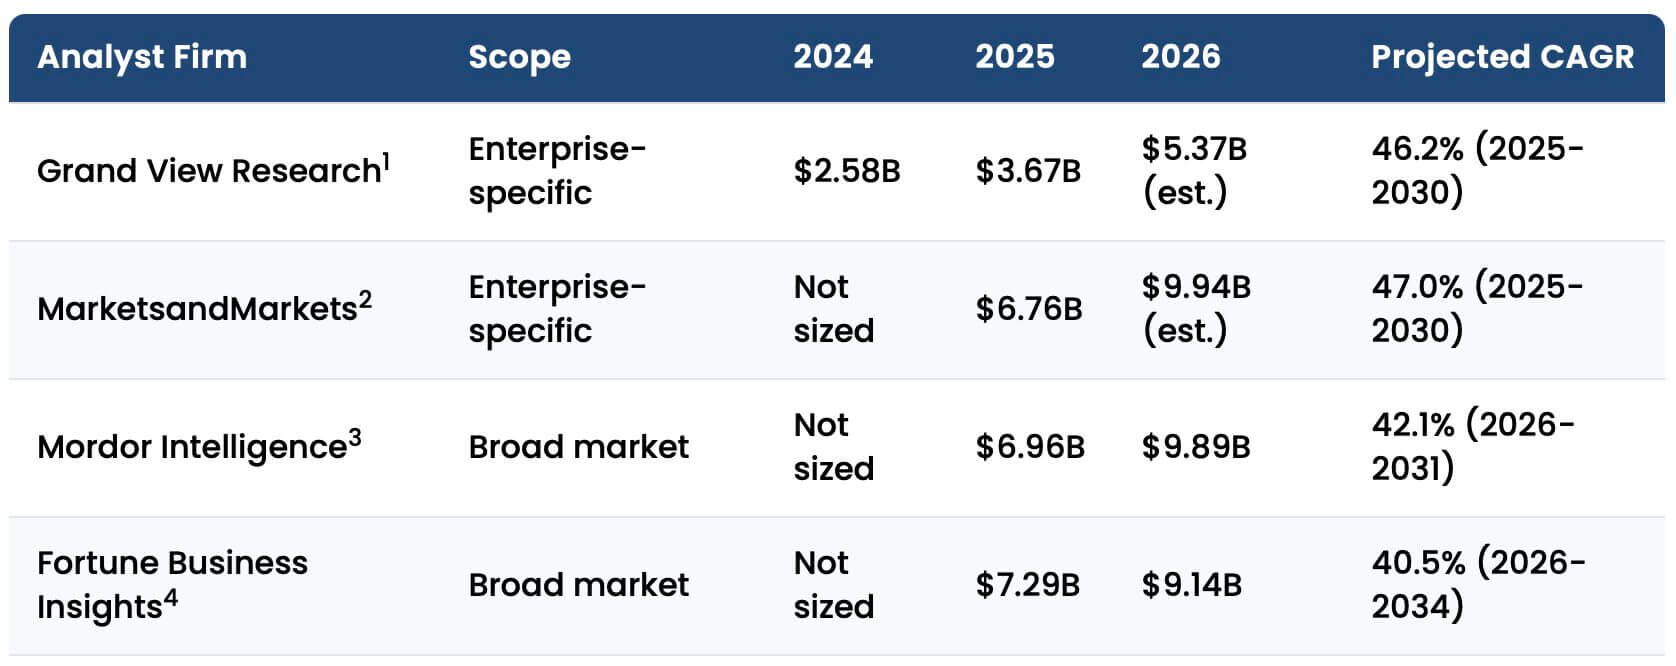
The market for AI-powered SDLC and coding tools has grown rapidly since 2024 and shows no sign of slowing. Analyst estimates differ on the exact figures, as they often do this early in a fast-moving category, but the trend line is consistent across sources: strong double-digit CAGR, with growth accelerating as agentic capabilities move from code completion into review, testing, and operations.
AI SDLC/Coding Tools Market Size, 2024-2026, with CAGR
| Year | Market Size (Range Across Analysts) | Notes |
|---|---|---|
| 2024 | $4.9B – $6.0B | Grand View Research and SNS Insider estimates |
| 2025 | $7.4B – $7.65B | Mordor Intelligence and Research and Markets estimates |
| 2026 (projected) | $9.35B – $9.46B | Consistent across Mordor Intelligence and Research and Markets |
| CAGR (2026 onward, through 2030-2032) | 24% – 26% | Range is consistent across multiple analyst firms |
Sources: 15, 16, 17
Caveat: Market size and CAGR figures vary by analyst methodology and scope definition. Rapid category-level growth also doesn’t mean every category within it is equally mature or equally safe to adopt broadly; treat the ranges here as directional.
What this means: Analyst estimates diverge on the exact figures, which is typical this early in a fast-moving software category, but the CAGR range, 24%-26% through the early 2030s, is consistent enough across firms to treat as a reliable signal that growth is accelerating, not just continuing.
Key Findings
- The AI SDLC/coding tools market grew from an estimated $4.9B-$6.0B in 2024 to $9.35B-$9.46B projected for 2026.
- CAGR estimates for 2026 onward, through 2030-2032, cluster in the 24%-26% range across multiple analyst firms.
- Growth is accelerating as agentic capabilities expand from code completion into review, testing, and operations.
In Practice
Market growth at this rate has a practical effect we see in client planning conversations: the tooling landscape is changing fast enough that a platform decision made in 2024 may already look conservative in 2026. We advise clients to build vendor flexibility into their AI tooling strategy rather than standardizing early on a single platform, particularly for capabilities, like agentic CI/CD and code review, that are still maturing quickly.
As the table below shows, code generation tooling is bought as commercial SaaS almost universally, while CI/CD and operations tooling is a mixed build-versus-buy picture, often because the governance requirements are specific enough to the client’s environment that an off-the-shelf platform doesn’t fully cover them.
Vendor concentration is loosening as the category matures. GitHub Copilot remains the largest installed base by a wide margin, but Cursor and Claude Code have both closed in on Copilot’s work-adoption share, and an entirely separate vendor landscape has emerged around code review and agentic CI/CD specifically. Most organizations are buying these capabilities as commercial platforms rather than building them; the exceptions tend to be large enterprises with proprietary codebases or compliance requirements substantial enough to justify a custom-built orchestration layer on top of a foundation model.
Leading Vendors/Platforms and Build vs. Buy Split
| Category | Leading Platforms | Build vs. Buy Pattern |
|---|---|---|
| Code generation / IDE assistant | GitHub Copilot, Cursor, Claude Code, Windsurf, JetBrains AI | Overwhelmingly bought as commercial SaaS or IDE-bundled subscriptions |
| AI code review | CodeRabbit, Qodo, Greptile, Sourcery | Bought; CodeRabbit alone covers 2M+ connected repositories |
| Agentic CI/CD & operations | CircleCI, GitHub Agentic Workflows, Azure SRE Agent, IBM Bob | Mixed; regulated enterprises increasingly build custom orchestration and governance layers on top |
| Custom enterprise deployments | Internal builds on foundation model APIs | Build; seen at scale in regulated industries with unique compliance or workflow needs |
Sources: 8, 10, 14, 15
Caveat: “Build” in this data typically means an orchestration and governance layer on top of a foundation model API, not a foundation model built from scratch. Vendor positioning in this fast-moving category can also shift quickly as the landscape consolidates.
What this means: Vendor concentration is loosening, and the build-versus-buy split is not uniform across categories. Code generation is overwhelmingly bought as commercial SaaS. CI/CD and operations tooling is mixed, and custom builds are concentrated among large, regulated enterprises with compliance requirements or proprietary codebases substantial enough to justify the investment.
Key Findings
- Code generation and IDE assistants (GitHub Copilot, Cursor, Claude Code, Windsurf, JetBrains AI) are almost universally bought as commercial SaaS or IDE-bundled subscriptions.
- AI code review tools are also predominantly bought; CodeRabbit alone covers 2M+ connected repositories.
- Agentic CI/CD and operations tooling shows a mixed build-versus-buy pattern, with regulated enterprises increasingly building custom orchestration and governance layers.
- Custom enterprise builds are concentrated at scale in regulated industries with unique compliance or workflow needs.
In Practice
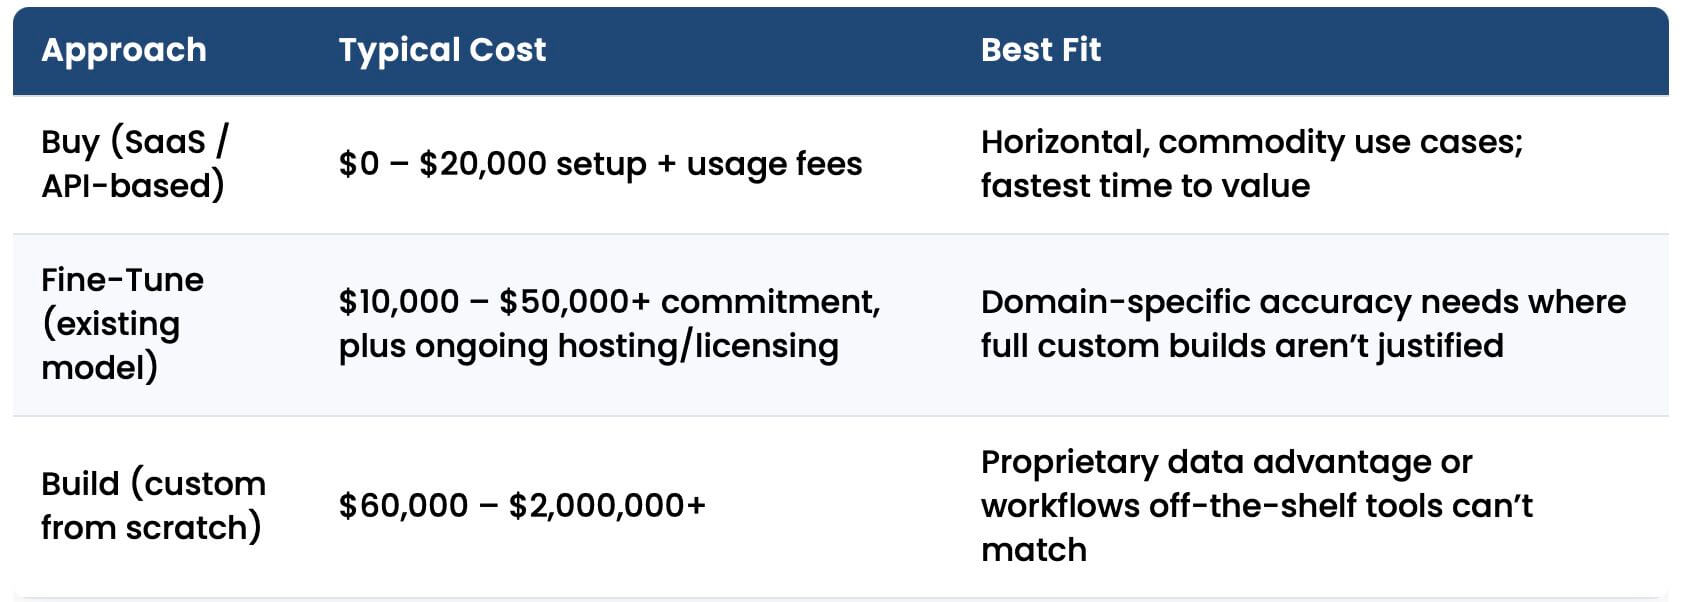
This build-versus-buy split matches what we recommend to clients directly. For code generation, testing, and code review, buying a mature commercial platform is almost always the right call; the market has consolidated enough that building a comparable capability in-house rarely makes economic sense. For CI/CD orchestration and incident response, particularly in regulated industries, the calculus changes, because the governance, audit, and compliance requirements are often specific enough to the client’s environment that a commercial platform needs a custom governance layer built around it regardless. Our work building RAG architecture and governance layers on top of foundation models for enterprise clients reflects exactly this pattern: buy the model capability, build the governance around it.
We haven’t seen a client engagement in recent years where building a foundation model in-house made sense; the build effort we see is almost always in the integration, governance, and workflow layer, not the underlying AI capability.
Strategic takeaway: Buy the commercial platform for code generation, testing, and code review, where the market has matured enough that build doesn’t pay off. Reserve custom build effort for the governance and orchestration layer around CI/CD and incident response, where compliance and workflow requirements are often too specific to any one client for an off-the-shelf platform to fully satisfy.
Conclusion: What Agentic AI Software Development Lifecycle Data Shows
Agentic AI’s footprint in the SDLC is real, but it’s not evenly distributed, and the adoption headlines can obscure where the actual value is landing. Code generation is mainstream and no longer a differentiator on its own; the more interesting signal in 2026 is that code review and incident response, both still comparatively early in adoption, are producing the strongest reported returns, while CI/CD orchestration remains the stage teams trust agents with the least.
DORA’s finding that higher AI usage correlates with both higher throughput and higher delivery instability is a useful reminder that adoption numbers alone don’t tell you whether a team is capturing value or just moving faster toward the same failure modes.
Across every section of this report, the same practical pattern shows up: value concentrates where teams have been deliberate about scope and governance, not where they’ve deployed the most broadly. In our work, that means treating agentic AI expansion as a sequencing question, code generation and testing first, code review next, then CI/CD and incident response only once verification and rollback practices can keep pace, rather than a race to full-lifecycle autonomy.
Teams evaluating where to invest next should weigh reported ROI by stage as heavily as raw adoption, and should expect the stages with the most hype (CI/CD agents, fully autonomous pipelines) to be the ones still furthest from safe, reliable production use.
For related analysis, see our Digital Transformation Statistics 2026 report and our Legacy Modernization Trends report.
Considering Agentic AI in Your Development Pipeline?
Adoption is accelerating, but so is the gap between teams that deploy agents thoughtfully and teams that create new instability. The right starting point isn’t the flashiest agent, it’s a clear-eyed assessment of where in your SDLC agentic AI would actually pay off. Talk to Keyhole Software about assessing your development pipeline for agentic AI readiness.
References
- Gartner, “2026 Hype Cycle for Agentic AI.”
- Gartner 2026 CIO and Technology Executive Survey, cited via xpander.ai, “Gartner’s Hype Cycle for Agentic AI: What It Means for AI Agent Development Platforms.”
- Hostinger, “Agentic AI statistics 2026: Market size, adoption, and growth data,” citing Gartner and McKinsey.
- Axis Intelligence, “AI Coding Assistant Statistics 2026: Adoption Rates, GitHub Copilot Data & Developer Trends,” citing Ziegler et al., Communications of the ACM (2024).
- Axis Intelligence, “GitHub Copilot Statistics 2026: Users, Revenue, Market Share & AI Coding Data,” citing JetBrains AI Pulse survey (April 2026).
- Uvik Software, “AI Coding Assistant Statistics 2026,” citing Stack Overflow Developer Survey 2025 and DORA 2024-2025 reports.
- Zylos Research, “Agentic CI/CD: AI-Driven Delivery Pipelines and the Rise of CA/CD.”
- Digital Applied, “AI Coding Tool Adoption 2026: Developer Survey Results.”
- DORA, “Balancing AI tensions: Moving from AI adoption to effective SDLC use” and “New DORA Report Claims Strong Engineering Foundations Drive AI Return on Investment,” InfoQ.
- SQ Magazine, “AI Agents Statistics 2026: Shocking Growth.”
- GetDX, “DORA metrics tools in 2026: What to measure, and what’s missing,” citing Booking.com case data.
- esynergy, “Key Lessons from 2025 DORA Report on AI’s Impact in Software Development,” via MEXC News.
- GetPanto.ai, “GitHub Copilot Statistics,” and “AI Coding Statistics — Adoption, Productivity & Market Metrics.”
- DEV Community, “The State of AI Code Review in 2026 – Trends, Tools, and What’s Next.”
- Mordor Intelligence, “AI Code Tools Market Size, Share & 2031 Growth Trends Report.”
- Research and Markets, “AI Code Tools Market Report 2026.”
- SNS Insider, “AI Code Tools Market to Hit USD 37.34 Billion by 2032,” via Yahoo Finance.
More From Keyhole Software
About Keyhole Software
Expert team of software developer consultants solving complex software challenges for U.S. clients.
Share This Post
Join The Thousands Of Devs Who Subscribe
Discuss This Article
Subscribe
Login
0 Comments
Oldest