
How to Estimate Software Development Time: A 6-Step Framework for Engineering Leaders
Most software timeline estimates fail for the same reason: they present a single confident number instead of a defensible range with a confidence interval, so the first surprise makes the whole estimate look wrong instead of one assumption changing.
This guide walks engineering leaders, CTOs, VPs of Engineering, and IT Directors who are scoping a project for budget approval or vendor selection through a six-step process for turning a rough project idea into a timeline estimate that survives review by finance and leadership. To follow it, you need a defined project or problem statement, someone with the authority to confirm what is in and out of scope, and a general sense of your team’s availability.
Keyhole Software’s consultants, who average more than 17 years of software development experience, estimate delivery timelines as a routine part of scoping custom software and legacy modernization work for mid-size and enterprise clients. This framework reflects the same method used in that process.
Before You Start
- A written project goal or problem statement, even a rough one
- A person who can make and confirm scope decisions
- A general read on who is available to do the work and when
- Access to your backlog or requirements list, if one already exists
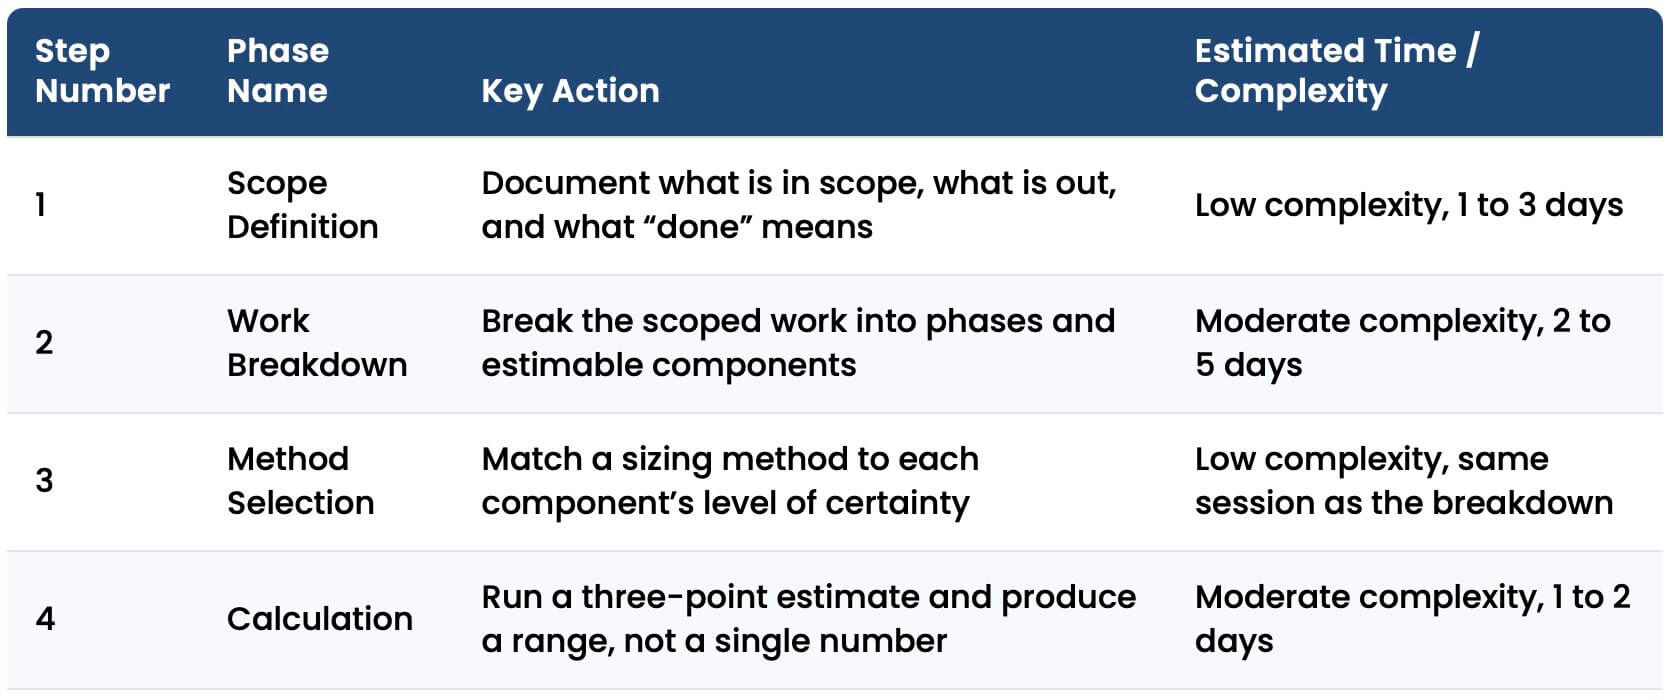
The Estimate-Building Process at a Glance
| Step Number | Phase Name | Key Action | Estimated Time / Complexity |
|---|---|---|---|
| 1 | Scope Definition | Document what is in scope, what is out, and what “done” means | Low complexity, 1 to 3 days |
| 2 | Work Breakdown | Break the scoped work into phases and estimable components | Moderate complexity, 2 to 5 days |
| 3 | Method Selection | Match a sizing method to each component’s level of certainty | Low complexity, same session as the breakdown |
| 4 | Calculation | Run a three-point estimate and produce a range, not a single number | Moderate complexity, 1 to 2 days |
| 5 | Risk Buffering | Add named buffers for scope creep, technical debt, and integration risk | Low complexity, half a day |
| 6 | Stakeholder Packaging | Translate the range into a presentation stakeholders can act on | Low complexity, half a day to 1 day |
This process works because it matches the estimation method to how well each piece of work is understood instead of applying one technique to the whole project. The stakes are real: research from Gartner found that 45 percent of enterprise software projects exceed their original timelines, largely due to inadequate process discipline rather than technical failure, a pattern we’ve written about in more detail in Keyhole’s custom software development process guide.5
Matching the method to how certain the work actually is happens to be one of the more overlooked pieces of that discipline, and it looks different depending on where a given piece of work sits in the project:
- Well-understood, backlog-ready work benefits from story points, which measure relative effort and avoid the false precision of hour-based guessing.1
- Early-stage or poorly-defined work benefits from t-shirt sizing, which is faster and does not pretend to a precision the team does not have.2
- The final number you bring to stakeholders benefits from three-point estimating, a technique built specifically to express a range of outcomes instead of a single guess.3
Mixing methods by stage, rather than picking one for the entire project, is what makes the final estimate both fast to produce and credible to defend.
Choosing the Right Estimation Method for Your Project Stage
Before you size anything, decide which technique fits where. Using the wrong method for a given stage is one of the most common reasons estimates fall apart under review.
| Method | Best-Fit Stage | Unit of Measure | Strength | Limitation |
|---|---|---|---|---|
| T-shirt sizing | Early scoping, roadmap planning | XS, S, M, L, XL | Fast, requires little upfront detail | Too imprecise for a final stakeholder number |
| Story points | Sprint-level planning, once a backlog exists | Relative point values | Reflects effort, complexity, and risk together, not just time1 | Requires an established backlog and team calibration |
| Three-point (PERT) | Final estimate for stakeholders | Optimistic, most likely, and pessimistic time values | Produces a weighted range that accounts for uncertainty3 | More time-consuming to calculate for every line item |
In practice, the method mismatch shows up most often at the story-point stage. Teams pull sprint-level detail into a stakeholder conversation before it has been rolled up into a range, and a set of point values that made sense internally reads as arbitrary to someone outside the team.
Story points remain the more widely used method overall, with industry survey data showing roughly half of agile teams rely on them compared to about a quarter using t-shirt sizing, but the two are not competing choices in this framework. They cover different stages of the same estimate.6
Sequencing note: Use t-shirt sizing to rough out the project during Step 2, story points once you reach sprint-level detail, and three-point estimating only for the roll-up number in Step 4. Trying to apply three-point estimating to every individual task adds effort without adding accuracy. Also note that precise story points are only reasonable for a mature team that has been working together for an extended period of time, and understands the business domain of the application.
Step-by-Step Instructions
Step 1: Define the Scope Boundary Before You Estimate Anything
An estimate is only as stable as the scope behind it. Write down what is included, what is explicitly excluded, and what “done” means before you size a single task.
- Write a one-page scope statement that names the goal, the audience, and the core functionality included (similar to the notion of an Amazon press release)
- List out-of-scope items explicitly, not just in-scope items
- Get sign-off from whoever owns the scope decision, in writing
- Note any assumptions you are making about existing systems or data
Common pitfall: Teams often estimate “the project” before anyone has agreed on what is excluded. The estimate is stale before work even starts, because the underlying scope was never fixed.
In our experience, the scope statement is worth revisiting even after sign-off. Stakeholders often agree to a scope boundary in the abstract, then treat the first missing feature as an oversight rather than something that was deliberately excluded. A written, initial scope statement is what settles that disagreement quickly instead of reopening it mid-project.
Step 2: Break the Work Into Estimable Units
Decompose the scoped work into phases, discovery, design, build, quality assurance, and deployment, then break the build phase further into features or components small enough to size individually.
- List each phase and its expected deliverables
- Break the build phase into components, not a single line item
- Keep each unit small enough that no single item represents more than roughly 10 percent of total project effort
- Flag any component that touches a legacy system, a third-party API, or unfamiliar technology
In Keyhole’s experience, the build-phase breakdown is where most estimated risk actually lives. Discovery and deployment tend to fall within a fairly predictable range, but build-phase effort swings widely based on how many components touch systems the team has not worked in before.
A component rarely blows up because the new code is hard to write. It blows up because the old system’s behavior isn’t fully known until someone opens it. We’ve modernized COBOL batch jobs and Delphi applications that had accumulated a decade or more of business rules nobody had documented, rules that only surfaced once a developer started tracing the logic line by line.
Treat any component touching a system like that as two separate line items: a discovery task to understand what the system actually does, and a build task to replace or extend it. Estimating them as one line item is how a “two-week integration” turns into a six-week one. The right level of granularity can make all the difference.
Step 3: Choose the Estimation Method for Each Unit
Match a sizing method to how well-understood each unit is, using the comparison table above. Do not default to one method for the entire project.
- Assign t-shirt sizes to any unit that is still loosely defined
- Assign story points to any unit that is backlog-ready and has clear acceptance criteria
- Reserve three-point estimating for the final, project-level roll-up number
- Document which method you used for each unit so the choice is visible later, not just the result
The documentation step gets skipped more than any other part of this process, usually because it feels like overhead in the moment. It matters later: when a stakeholder asks why one component was sized in story points and another in t-shirt sizes, having the reasoning on record is the difference between a quick answer and a credibility problem.
One warning sign worth watching for during this step: a cluster of components all sized “M.” When a team is unsure how to size something, “medium” is the easiest box to default to, and it quietly erases the signal t-shirt sizing is supposed to provide. If more than a handful of components land on the same size, that’s usually a sign the team hasn’t looked closely enough to tell them apart yet, not that the work is genuinely uniform. Push those back into Step 2 for a closer look before moving on.
Step 4: Run the Calculation and Produce a Range
Apply the chosen method to each unit, then combine the results into a project-level range using a three-point calculation for the number you will present externally.
- Gather an optimistic, most likely, and pessimistic duration for each major phase or component
- Calculate the weighted expected value using the standard PERT formula: (Optimistic + 4 × Most Likely + Pessimistic) ÷ 63
- Sum the phase-level results into a project-level range
- State the range as a range, not a single midpoint number, when you record it
Common pitfall: Reporting only the most-likely number and dropping the optimistic and pessimistic bounds turns a range into a promise. When reality lands outside that single number, the estimate looks wrong even if the underlying math was sound.
Worked example: Say one build-phase component has an optimistic estimate of 3 weeks, a most likely estimate of 5 weeks, and a pessimistic estimate of 9 weeks. Using the PERT formula, (3 + 4×5 + 9) ÷ 6, that component works out to roughly 5.3 weeks.3 Run the same calculation for every phase or component, then add the results together for the project-level range. The weighting toward the most-likely figure is intentional. It keeps a single worst-case outlier from dragging the whole estimate off course.
Step 5: Apply Buffers for Known Risk Categories
Add buffer time for the risks most likely to affect a software project: scope creep, undiscovered technical debt, and third-party integration risk. Size each buffer to the project’s real exposure instead of using one flat percentage for everything.
- Add a scope buffer sized to how firm the requirements actually are
- Add a technical debt buffer for any legacy system in scope that has not been directly assessed
- Add an integration buffer for any dependency on a third-party API, vendor timeline, or external documentation
- Write down the reason for each buffer next to the number
Common pitfall: A single, unexplained “contingency” line is the first thing stakeholders question and the first thing that gets cut under budget pressure. A named, itemized buffer is far more defensible.
The integration buffer is the one teams most often underestimate. A dependency on a third-party API can hold up a schedule even when every other part of the project is on track, especially when the vendor’s documentation or release timeline is outside your control.
The failure pattern is usually the same: a sandbox or test environment that doesn’t fully match what production actually does, and nobody finds out until integration testing starts. Rate limits that aren’t documented, a webhook that fires in a different order than the docs describe, a field that’s nullable in practice even though the schema says it isn’t.
None of that shows up during scoping. It shows up when your team is already wiring the connection together. Size the integration buffer against how much of the real integration behavior you can actually verify before go-live, not just against whether a third-party dependency exists on paper. Keyhole’s guide to achieving effective API test coverage covers practical ways to close that verification gap before it turns into a schedule risk.
Step 6: Package the Estimate for Stakeholder Review
Translate the range, the assumptions behind it, and the buffer rationale into a format finance or leadership can actually act on, with a stated point at which you will re-estimate.
- Lead with the range, not a single number
- List the two or three assumptions that most affect the estimate
- Show the named risk buffers from Step 5, not a lump sum
- Set a specific checkpoint, tied to a milestone or date, for revisiting the estimate as scope firms up
Common pitfall: Delivering a number with no stated assumptions attached. When one of those unstated assumptions changes, later, it reads as the team getting the estimate wrong instead of a known variable shifting.
We’ve found that stakeholders tend to remember the re-estimation checkpoint more than the range itself. A number that comes with a stated point for revisiting it reads as a managed process. A number with no checkpoint reads as a one-time guess, even when the underlying math was identical.
Most of this step has less to do with the math and more to do with translation. The people approving the budget usually aren’t the people who did the sizing, and a range that makes perfect sense to an engineering team can still land badly if it’s handed over without context. Keyhole’s guide to bridging the communication gap between software teams and business stakeholders goes deeper on that translation problem.
Common Estimation Pitfalls That Blow Up Timelines
Even a well-run estimating process can be undone by a handful of recurring risks. Watch for these signs early.
| Pitfall | Early Warning Sign | Mitigation |
|---|---|---|
| Scope creep | The requirements list keeps growing after scope sign-off | Route every new request through a change control step that checks it against the original scope statement |
| Unknown technical debt | Legacy or third-party systems are in scope but have not been directly assessed | Run a short technical assessment on any system the project touches before finalizing the estimate |
| Third-party integration risk | The timeline depends on a vendor’s API, release schedule, or documentation quality | Size a dedicated buffer for any integration point outside your team’s direct control |
In our experience, these three pitfalls rarely show up alone. A project with unassessed technical debt is often the same project where a third-party integration turns out to be more fragile than documented, since both point to the same root cause: a system nobody on the team has worked in closely before.
We treat that overlap as a signal rather than a coincidence. If a scoping conversation surfaces a legacy system nobody currently on the team has ever touched, assume there’s also an integration or a dependency riding on that same system that hasn’t yet been named. It’s rarely worth trying to separately estimate “the legacy risk” and “the integration risk” for that component; it’s faster and more honest to fold them into a single, larger discovery task and say so explicitly in the estimate.
How AI Is Changing Software Development Timelines
AI-assisted development can compress parts of a software timeline, but it changes the build phase specifically, not the whole estimate. Understanding where it helps keeps your range realistic instead of overly optimistic.
| Estimate Component | Traditional Approach | AI-Accelerated Approach | What Changes |
|---|---|---|---|
| Discovery and scoping | Manual requirements gathering and stakeholder interviews | Largely unchanged | Minimal compression |
| Build phase | Manual coding across each component | AI-assisted code generation under architect-led review | Meaningful compression possible |
| QA and testing | Manual and automated test cycles | AI-assisted test generation, still under senior review | Some compression, quality gates remain |
| Deployment | Manual cutover and validation | Largely unchanged | Minimal compression |
In practice, this compression only shows up when senior engineers are still setting the architecture and reviewing the output. In one recent modernization engagement, an effort originally estimated at 18 to 24 months was delivered in roughly 5 months using AI as an acceleration layer inside an architect-led delivery process.4
Treat this as a build-phase adjustment you apply after Step 4, not as a discount on the full project timeline, and keep the discovery, QA, and deployment portions of your estimate grounded in the same process you would use without AI involved.
In Keyhole’s experience, teams that skip the architect-led review step to move faster tend to eventually lose the time savings later, once the code reaches production and needs rework. The compression holds only when senior engineers stay in the loop on the output, not when AI is left to run unsupervised.
The compression also isn’t evenly spread across the build phase, and estimating it as if it were is a common way AI-adjusted timelines end up too optimistic. It concentrates in work that follows a learnable pattern: CRUD scaffolding, standard REST endpoints, boilerplate test cases, and code that mirrors conventions already established elsewhere in the codebase. It shows up far less in the decisions that actually determine whether a modernization project succeeds: how to model the data, how to sequence the cutover, and which pieces of legacy business logic are worth preserving versus rebuilding.
When you apply an AI adjustment to your build-phase estimate, apply it component by component based on how much of that component looks like pattern-following work, not as a flat percentage off the whole phase.
Presenting Your Estimate to Stakeholders
Use this checklist before you bring your number into a budget or vendor selection conversation.
- Range: State the optimistic, most likely, and pessimistic figures, not just one number
- Assumptions: List the two or three assumptions most likely to move the estimate if they change
- Risk buffers: Show each named buffer and the reason behind it, not a single contingency line
- Re-estimation checkpoint: State when the estimate will be revisited, tied to a milestone or date
A range with stated assumptions is more credible to finance and leadership than a single confident number, not less. It shows the team understands where the real uncertainty sits.
The conversation goes differently once a range replaces a single number. Stakeholders shift from asking “why were you wrong” to asking “what would move this,” which is a much easier conversation to have and a much easier one to prepare for.
The same principle holds whether you’re asking finance to approve a budget or asking your own team to adopt a new tool or process: lead with the reasoning, not just the outcome you want them to accept. Keyhole’s guide to proposing improvements to a dev team covers the internal-facing version of that same challenge, building buy-in for a change before you roll it out rather than defending it after the fact.
How to Estimate Software Development Time Going Forward
Once your estimate is built, the work shifts from producing the number to protecting it: tracking actuals against the range, watching for the early warning signs listed above, and revisiting the estimate at the checkpoint you set in Step 6. A repeatable process like this one is what makes an estimate something you can defend in the room, not just a number you hope holds up.
Keyhole Software works through this same process, scoping, breaking down, sizing, buffering, and packaging, on custom software and legacy modernization engagements for mid-size and enterprise organizations. If your team has already estimated this system once, that history is worth more than a flat contingency percentage. Build the discount into your Step 2 discovery task directly, based on what you actually learned last time, rather than re-running the same buffer you’d use for a system nobody’s opened before.
We see this compound over long client relationships (roughly 78 percent of our annual work is repeat business), where a fourth-phase estimate looks nothing like the first. If you are scoping a project and want a second set of eyes on the estimate before it goes to budget approval, contact Keyhole Software to talk through it.
References
- Agile Alliance. “What are Story Points?” Agile Alliance Glossary. https://agilealliance.org/glossary/points-estimates-in/
- Atlassian. “What are Story Points in Agile and How Do You Estimate Them?” https://www.atlassian.com/agile/project-management/estimation
- Project Management Academy. “Three-Point Estimating PMP Exam Resource” (citing the PMI PMBOK Guide). https://projectmanagementacademy.net/resources/blog/three-point-estimating-pmp-exam-resource/
- Keyhole Software. “AI Software Development Costs 2026: Enterprise Spending, TCO, and ROI Analysis.” https://keyholesoftware.com/ai-software-development-cost-2026/
- Gartner. “Software Project Management Best Practices,” 2024, as cited in Keyhole Software’s “Custom Software Development Process: Enterprise Best Practices 2026.” https://keyholesoftware.com/blog-custom-software-development-process/
- Atlassian. “How to Choose the Best Methods of Estimation for Planning,” citing the 11th Annual State of Agile Report. https://www.atlassian.com/blog/add-ons/choose-best-methods-estimation-planning
More From Keyhole Software
About Keyhole Software
Expert team of software developer consultants solving complex software challenges for U.S. clients.
Share This Post
Join The Thousands Of Devs Who Subscribe
Discuss This Article
Subscribe
Login
0 Comments
Oldest